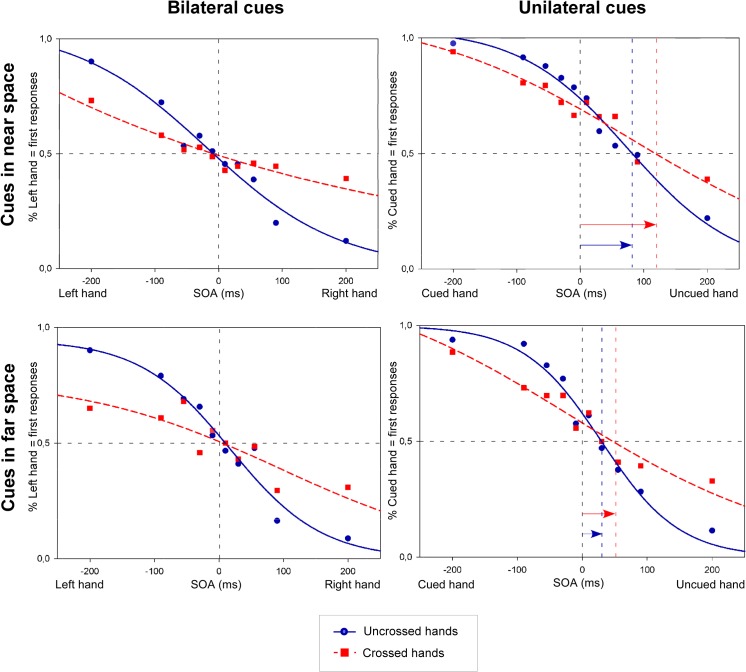
Fig 2. Nociceptive temporal order judgments (TOJs) in Experiment 1.
The figures illustrate the fitted curves from cumulative data from 21 participants. Trials were either associated with bilateral cues (left side of the figure), or with an unilateral cue (right side of the figure), with cues in near space (upper part figure), or with cues in far space (lower part figure), and with an uncrossed (blue solid line) or a crossed (red dashed line) posture. Data are plotted as the mean proportion of left hand first responses (on the Y-axis; left side of figure, bilateral cues) or cued hand first responses (on the Y-axis; right side of figure, unilateral cues), as a function of the stimulus onset asynchronies (SOA) (on the X-axis). On the X-axis, for the bilateral cue conditions, the negative values of the SOAs indicate that the left hand was stimulated first, and the positive values indicate that the right hand was stimulated first. In the unilateral cue condition, negative values indicate that the cued hand was stimulated first, while positive values indicate that the uncued hand was stimulated first. The blue (uncrossed hands) and red (crossed hands) vertical dashed lines, and the length of the blue and red arrow coincide with the PSS values. Compared to the bilateral cue conditions, the curves in the unilateral cue conditions were shifted toward the uncued side both for the uncrossed and the crossed posture. This indicates that the nociceptive stimulus on the uncued hand had to be presented several milliseconds before the stimulus on the cued hand to have an equal chance to be perceived first, regardless of posture. The JND characterizes the slope of the functions: the steeper the slope, the lower the JND and the higher the temporal sensitivity (and vice versa).

