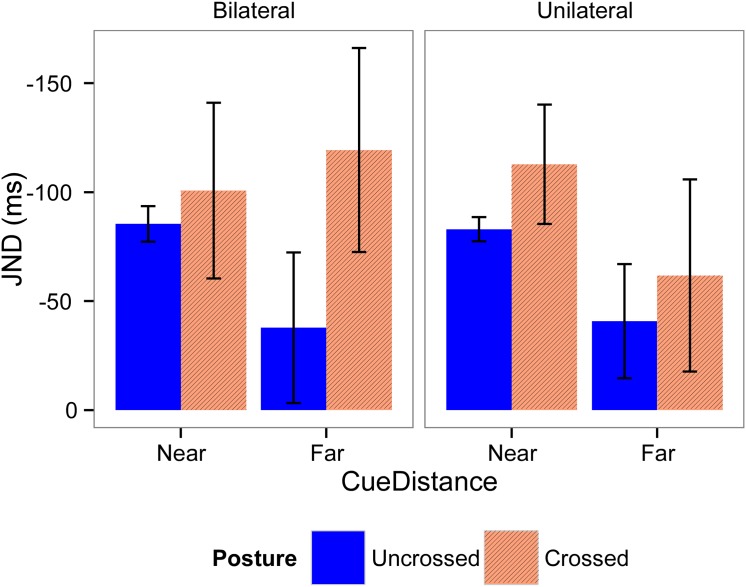
Fig 6. Means and standard errors for the JND for Experiment 1.
JND values were calculated according the laterality of the visual cues (left graphic, bilateral cues; right graphic, unilateral cue), distance of the cues (left part of the graphics, near; right part of the graphics, far), and posture of the hands (blue bars, uncrossed; red bars, crossed). There were no significant differences between conditions.

