
Fig 5. Particle recovery efficiency with respect to flow rate ratio.
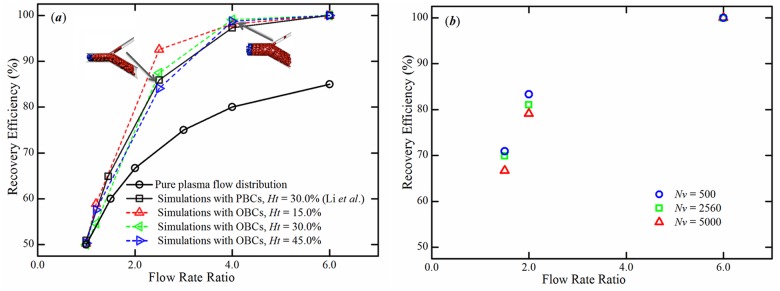
(a) Particle recovery efficiency at different hematocrit levels. Two snapshots of the RBCs at microvascular bifurcations with flow rate ratios of 2.5 and 4.0 at H t = 45.0% are shown. Simulation data (black squares) from [32] are shown. (b) Particle recovery efficiency at different levels of coarse-graining of the MS-RBC model at H t = 15.0%. The simulations are conducted using the MS-RBC model with N v = 500, 2560 and 5000.