

Abstract
Background
Characteristics of the physical environment can be classified into two broad categories: macro- (“raw” urban planning features influenced on a regional level) and micro- (features specifically within a streetscape influenced on a neighborhood level) environmental factors. In urban planning applications, it is more feasible to modify conditions at the neighborhood level than at the regional level. Yet for the promotion of bicycle transport we need to know whether relationships between micro-environmental factors and bicycle transport depend on different types of macro-environments. This study aimed to identify whether the effect of three micro-environmental factors (i.e., evenness of the cycle path surface, speed limits and type of separation between cycle path and motorized traffic) on the street’s appeal for adults’ bicycle transport varied across three different macro-environments (i.e., low, medium and high residential density street).
Methods
In total, 389 middle-aged adults completed a web-based questionnaire consisting of socio-demographic characteristics and a series of choice tasks with manipulated photographs, depicting two possible routes to cycle along. Conjoint analysis was used to analyze the data.
Results
Although the magnitude of the overall effects differed, in each macro-environment (i.e., low, medium and high residential density), middle-aged adults preferred a speed limit of 30 km/h, an even cycle path surface and a hedge as separation between motorized traffic and the cycle path compared to a speed limit of 50 or 70 km/h, a slightly uneven or uneven cycle path surface and a curb as separation or no separation between motorized traffic and the cycle path.
Conclusions
Our results suggest that irrespective of the macro-environment, the same micro-environmental factors are preferred in middle-aged adults concerning the street’s appeal for bicycle transport. The controlled environment simulations in the experimental choice task have the potential to inform real life environmental interventions and suggest that micro-environmental changes can have similar results in different macro-environments.
Background
Globally, 31% of adults aged 15 years or older are insufficiently physically active, [1,2], which is reflected in the rapidly increasing prevalence of inactivity-related health problems [2]. In the European Union, there is a significant unfulfilled potential to increase bicycling behavior of the population, since 50% of all trips are shorter than 3 kilometers, a distance which can be cycled in 10 minutes [3]. In Flanders (Belgium), more than 70% of these trips (≤ 3 km) are currently done using passive transport [4]. Bicycle transport is an accessible, economic, social, and environmentally sustainable form of physical activity, easy to integrate into adults’ daily routines and moreover has the potential to increase physical activity levels in European adults. Cross-sectional studies indicated that bicycle transport is associated with higher general physical activity levels and lower body weight in adults [5]. Prospective observational studies demonstrated a strong inverse relationship between bicycle transport and all-cause mortality, cancer mortality, and cancer morbidity among middle-aged participants [6]. In addition, active transport has many other positive economic, social, environmental and traffic management effects [6–15]. Because of these benefits, communities should encourage people to cycle on a regular or daily basis [16–19]. One long-term approach to do this involves changes to the physical environment to make it more supportive of bicycling [20]. Environmental interventions and policies targeting the physical environment, can reach large populations over long periods of time and encourage more bicycling and less reliance on the car [7,21,22]. The physical environment can be defined as “the objective and perceived characteristics of the physical context in which people spend their time (e.g. home, neighborhood), including aspects of urban design, traffic density and speed, distance to and design of venues for physical activity (e.g., parks), crime and safety” [23]. Previous studies already indicated that the physical environment appears to be an important contributor to encourage bicycle transport among middle-aged adults [22,24].
Characteristics of the physical environment can be classified into two broad categories: macro- and micro-environmental factors [25,26]. Macro-environmental factors can be defined as the more “raw” urban planning features; such as street network density, residential density and land use diversity. These factors may be difficult to change in existing neighborhoods, because of their size and complexity and moreover because this would require a strong collaboration between regional authorities. Macro-environmental factors are essentially beyond the influence of individuals and even for governments and nongovernmental organizations it is usually difficult to modify large existing structural features [25,26]. Micro-environmental factors, however, can be defined as specific characteristics of environmental features within a streetscape; such as evenness cycle path surface, vegetation and speed limits. In urban planning applications, it is more feasible to modify conditions at the neighborhood level than at the regional level because these micro-environmental factors are relatively small-scaled environmental factors and potentially influenced by individuals or local actors [25,26]. Therefore, the reconfiguration of micro-environmental factors in existing neighborhoods involves a lower cost and a shorter time-frame compared to the reconfiguration of the macro-scale structural design [25,26], making micro-environmental factors more practical and promising to target in physical environmental interventions of existing neighborhoods. Studies around the world have found consistent positive relationships between macro-environmental factors (including walkability, access to shops/services/work, and urbanization) and transport-related bicycling in adults [25,26]. Unfortunately, the relationships between bicycle transport and more amenable, micro-environmental factors are less consistent [27–29]. These inconsistencies in the literature are potentially attributed to the used methodology.
Although various studies have investigated the relationships between the physical environment and physical activity, they are often cross-sectional and thus not able to establish causality [30–32]. In these studies, environmental perceptions were generally assessed with questionnaires, which involves some difficulties. First, participants have to recall features of the physical environment, which leads to recall bias [33], and second the lack of standardization in neighborhood definitions increases the inconsistency as well [34]. Moreover, because many physical environmental factors are interrelated in real life conditions, these studies cannot clearly identify the critical environmental correlates of bicycle transport. Experimental studies are required to decrease these inconsistencies and to make causal statements [22,30–32,35]. Since experiments are complex, time- and cost-consuming to conduct in real environments, an innovative experimental and cost-effective methodology is required.
Therefore, the present study opts for a controlled experiment: it uses controlled manipulations of environmental characteristics in photographs to experimentally find out whether these characteristics affect the street’s appeal for bicycle transport. As research shows that responses to photos generalize well to on-site response [36,37], the findings can provide guidelines for interventions that modify micro-environmental factors to increase the street’s appeal for bicycle transport. This methodology was used in two recent mixed-methods studies to determine possible causal relationships between a limited number of key micro-environmental factors and the street’s appeal walking transport among older adults [38] and bicycle transport among adults [39]. This latter pilot study provided a first indication of the effects of changing micro-environmental factors on the street’s appeal for bicycle transport in adults. However, this pilot study had an important limitation: it used only one macro-environment, a typical street environment in a semi-urban (300–600 inhabitants/km2) Belgian municipality [40]. For interventions, it is essential to know how well the findings can be generalized to other macro-environments. If micro- and macro- environmental factors are interacting, interventions focusing on micro-environmental factors may have to differ depending on the macro-environment.
Therefore, the current study aims to find out if the effect of manipulated micro-environmental factors (evenness of the cycle path surface, speed limit and type of separation between cycle path and motorized traffic) on the street’s appeal for middle-aged adults’ bicycle transport depends on macro-environmental factors or is generalizable to different macro-environments (i.e. low, medium and high residential density street).
Methods
Protocol and measures
Flemish middle-aged adults between 45 and 65 years were recruited by purposeful convenience sampling [41] using email, social media, family, friends, clubs and organizations. By snowball sampling [41], additional participants were recruited. This age group was chosen as adults in this age range do assess the environment according to themselves, rather than in the viewpoint of their children. Participants completed a two-part web-based questionnaire, which was developed using Sawtooth Software (SSIWebversion 8.2.4.). It first assessed socio-demographic characteristics, and second the participant had to perform a series of choice tasks with manipulated photographs (a detailed description of these choice tasks appears later in this paper). Informed consent was automatically obtained from the participants when they voluntarily completed the questionnaire. The online questionnaire was available from the beginning of February until the end of March 2014 and 389 middle-aged adults participated in the study. The study was approved by the Ethics Committee of the Ghent University Hospital.
Photograph development
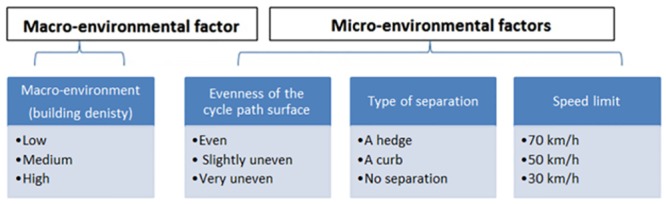
The manipulated photographs, depicting a possible route to cycle along, used in the choice task were developed with Adobe Photoshop software [42]. Previous research has established the validity of responses to color photos in comparison to on-site responses [36,37]. In each photograph, four environmental factors (one macro- and three micro-environmental factors) were manipulated and each environmental factor consisted of three possible levels (see Fig 1), yielding a total of 81 (= 34) photographs. One of the four manipulated environmental factors was considered as a macro-environmental factor and was defined in this study according to residential building density and land-use mix depicting the general street setting. Three levels were distinguished: (1) environment with low building density (open environment) and single land use, (2) environment with medium building density and single land use, (3) environment with high building density and mixed land use. See S1 File for an example of all three different street settings or macro-environments used in this study. Additionally, three micro-environmental factors (evenness cycle path surface, speed limit and type of separation between cycle path and motorized traffic) were manipulated in each photograph and consisted of an anticipated attractive, intermediate and unattractive level (e.g. even cycle path surface, slightly uneven cycle path surface and a very uneven cycle path surface). These three micro-environmental factors were chosen based on previous research [27,39,43,44] and existing literature on the relationship between the environment and bicycle transport [27,45]. Each photograph was developed from an adult cyclist’s eye level viewpoint, under dry weather conditions and without people visible in the environment. Fig 1 and S1 File provides an overview and illustration of the four manipulated environmental factors with their respective levels (the terms presented in Fig 1 are used throughout the article).
Fig 1. An overview of the environmental factors and their respective levels used in the choice tasks (ref. S1 File).
The web-based questionnaire
The web-based questionnaire had two parts. The first part assessed socio-demographic characteristics: gender, age, country of birth, education, occupational status, marital status and place of residence (see Table 1 for the response categories). Next, the long form of the International Physical Activity Questionnaire (IPAQ: ‘usual week’) [46] was used to establish the amount of usual amount of bicycle transport in a week. The second part of the questionnaire consisted of a series of choice tasks, based on a choice based conjoint (CBC) method. This CBC method is mainly used in marketing research and enables examination of preferences for various components of a product in the decision process to pursuit the product [47]. In this study the various components are the different manipulated environmental factors and the product is a street’s appeal for bicycle transport along the depicted environments. Despite conjoint analysis is more than forty years old, it continues to evolve by new technology and methodologies [47]. Furthermore, besides marketing research an ongoing stream of research is making use of this technique [48]. Conjoint analysis has been proved to be one of the best tools available for determining relative importance of factors of complex environments from the user point of view [49,50]. Using photographs to display alternatives of complex environments rather than written descriptions, immediately gives a clear view or understanding of what should be assessed (i.e. reduce recall bias). The following scenario was presented to the respondents: “Imagine yourself bicycling to a friend’s home, located at 10 minutes bicycling from your home, during daytime with perfect weather circumstances. For every task you will see two streets, we ask you to choose the street that you find most appeal to cycle along to a friend. Whichever route you choose the distance to your friend is the same and all cycle paths are one-way. There is no right or wrong solution, we are only interested in which street you would prefer to cycle along.” First, participants could see three examples and afterwards they received a set of 14 randomly assigned choice tasks. More than 20 choice tasks may make respondents less likely to complete the task [51]. The computer program randomly determined the picture pairs that appeared in the choice tasks, allowing each level within each attribute to appear an equal number of times in the choice task and consequently allowing that not all possible combinations need to be presented to each participant.
Table 1. Descriptive characteristics of the participants (n = 389).
| Age (M ± SD) (year) | 53.8 ± 5.2 | Occupational status (%) | |
| Women (%) | 55.3 | - Household | 4.4 |
| Born in Belgium (%) | 96.4 | - Blue collar | 6.7 |
| Marital status (%) | - White collar | 68.9 | |
| - Married | 75.3 | - Unemployed | 3.9 |
| - Widowed | 2.3 | - Retired | 15.2 |
| - Divorced | 10 | - Career interruption | 1 |
| - Single | 4.4 | BMI (M ± SD) | 24.8 ± 4.0 |
| - Cohabiting | 8 | Current bicycle transport level | |
| Education (%) | - Bicycle transport min/wk (M ± SD) | 37.3 ± 33.1 | |
| - Primary | 1.8 | - No bicycling for transport (%) | 24.69 |
| - Lower secondary | 19 | ||
| - Higher secondary | 13.4 | ||
| - Tertiary | 65.8 |
M = mean; SD = standard deviation; BMI = body mass index
An a priori power analysis (power 0.80 and α = 0.05) calculated by the following formula: nta /c > 500 (n = number of participants; t = 14: number of choice tasks; a = 2: number of alternatives per task; c = 9: the largest product of levels of any two factors) [47] showed that a minimum of 161 subjects was needed when manipulating four environmental factors in one photograph (with three levels each) and presenting 14 choice tasks to each participant.
To assess test-retest reliability, we conducted a pilot study (n = 27) in which four fixed tasks were deliberately added to the set of choice tasks. In this pilot study, participants had to complete 16 choice tasks. The same two choice tasks were presented at the beginning and at the end of the questionnaire. These choice based conjoint tasks were identical for all participants (= fixed tasks). Subsequently, it was examined whether participants chose the same street both times. The percentage of agreement for the first task was 81% and 93% for the second fixed task (n = 27). An adequate level of agreement is generally considered to be 70% [52]. These results indicated that our choice tasks are reliable.
Analyses
Choice-based conjoint analysis (CBC)
Choice-based conjoint analysis (CBC) was used to analyze the data [47]. First, average part-worth utilities were calculated from the individual utilities gained from hierarchical Bayes (HB) estimation to determine the main effects of each environmental factor on the street’s appeal for bicycle transport along the depicted environments. This has been suggested as the most appropriate method to analyze data gained from choice based conjoint [53]. Utilities represent the degree of preference given to a particular level of an environmental factor and are similar to a β obtained from linear regression analyses [47].
Second, the average relative importance of each environmental factor was calculated from the individual utility data gained from hierarchical Bayes (HB) estimation. Utility values cannot be compared across components, because they have different metrics, but each component has a unique scale determined through the hierarchical Bayes estimation procedure. Therefore, the difference in individual utilities between the most and least preferred levels of a component can be used to represent the importance of each component for each respondent [47]. This individual importance represents the relative importance of each environmental factor when judging a street on the street’s appeal for adults’ bicycle transport. An individual importance is calculated by subtracting the lowest from the highest utility for the given factor and dividing this by the sum of differences across all components for that participant. The individual relative importance can in turn be used to calculate the average relative importance of each component for the total sample [47]. Furthermore, also the relative importance of the micro-environmental factors within each macro-environment was calculated.
Third, interaction effects were also derived from part-worth utilities gained from the hierarchical Bayes (HB) estimation using dummy coding (burn in: 100,000; total iterations: 1,100,000). Three separate models were constructed to analyze the interaction effects of micro-environmental factors with the macro-environment: ‘macro-environment by evenness of the cycle path surface’, ‘macro-environment by speed limit’ and ‘macro-environment by type of separation between cycle path and motorized traffic’. The interaction effects were illustrated by graphs and tables in which the total utilities of the different streets were shown. Total utilities were calculated by the sum of the part-worth utilities, representing the degree of preference given to a particular level of an environmental factor. The size of the interaction effect was determined by calculating the difference in total utilities for each participant separately. The average of these values over all subjects, is the average interaction effect. A 95% confidence interval was calculated to define significance.
Results
Descriptive statistics
In total, 389 adults (214 women and 175 men) between 45 and 65 years participated in the study. Most participants (65.8%) reported a tertiary education degree (higher, university or postgraduate). Approximately one quarter of the participants said they did not cycle for transport in a usual week. See Table 1 for other descriptive characteristics of the sample.
Main effects of the environmental factors
For the macro-environmental factor, participants preferred a low (average part-worth utility = 1.93±3.45; 95% CI: 1.59, 2.27) residential density street above a medium (0.76±1.89; 95% CI: 0.58, 0.95) or high (reference level) residential street. Moreover, they preferred a medium residential density street to a high residential street. For the micro-environmental factors, participants preferred an even cycle path surface (3.61±5.01; 95% CI: 3.11, 4.11) to a slightly uneven (2.25±2.49; 95% CI: 2.00, 2.50) or very uneven (reference level) cycle path; and they preferred a slightly uneven cycle path surface to a very uneven cycle path surface. They also preferred a traffic limitation of 30 km/h (4.43±2.90; 95% CI: 4.14, 4.72) to one of 50 km/h (2.51±1.62; 95% CI: 2.35, 2.67) or 70 km/h (reference level) and they preferred a traffic limitation of 50 km/h to one of 70 km/h. Finally, the participants preferred a cycle path separated from traffic with a hedge (4.91±3.13; 95% CI: 4.60, 5.22) to one separated from traffic with a curb (2.04±1.90; 95% CI: 1.86, 2.23) or one located on the street (reference level), and they preferred a cycle path separated from traffic with a curb to one located on the street. See S1 File for an illustration of the different manipulations (e.g. the different types of separations between cycle path and motorized traffic).
Relative importance of the environmental factors
The average importance of the four factors, based on individual utility calculations, shows that the macro-environment was the least important factor in making choices among the different street alternatives. Given that there is no overlap between the confidence intervals of the micro-environmental factors, it appears that the average importance of the macro-environment (18.15±14.66%; 95% CI: 16.69, 19.61) was significantly lower compared to the three micro-environmental factors. The three micro-environmental factors, however, did not significantly differ from each other in relative importance with 26.71±22.36% (95% CI: 24.48, 28.93) for evenness of the cycle path surface, 26.68±16.50% (95% CI: 27.04, 30.32) for type of separation between cycle path and motorized traffic and 26.47±15.62% (95% CI: 24.92, 28.02) for speed limit.
Relative importance of the micro-environmental factors within each macro-environment
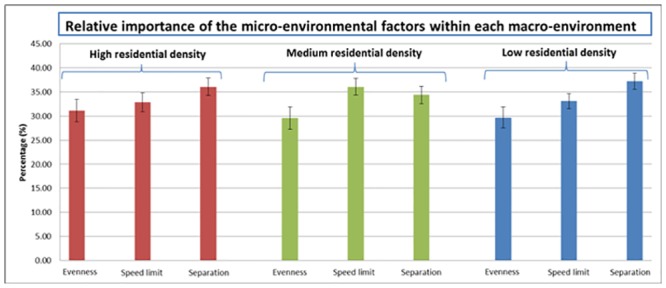
Greater importance was found for type of separation between cycle path and motorized traffic than for evenness of the cycle path surface in each macro-environment (see Fig 2). The results showed that in a low residential density environment a separation (37.20±16.98%; 95% CI: 35.51, 38.89) was also more important than the presence of speed limit (33.10±15.47%; 95% CI: 31.56, 34.63). In a medium residential density environment, the presence of a speed limit (36.05±17.56%; 95% CI: 34.31, 37.80) was more important than the evenness of the cycle path surface (29.57±23.13%; 95% CI: 27.27, 31.87). The remaining importance of the micro-environmental factors did not significantly differ from each other in each macro-environment.
Fig 2. The average relative importance of the three micro-environmental factors in each macro-environment.
Interaction effects
Interaction between macro-environment and evenness of the cycle path surface
Fig 3 shows the overall utilities for streets differing in macro-environment and evenness of the cycle path surface. The characters on Fig 3 illustrate the distance between the total utilities. In each macro-environment, an even cycle path surface was preferred for bicycling to a slightly or very uneven cycle path surface, and a slightly uneven was preferred to a very uneven cycle path surface. Only the strength of this positive effect of evenness of the cycle path surface differed between the three macro-environments. The effect of an even cycle path surface compared to a very uneven cycle path surface or a slightly uneven cycle path surface was lower in a medium residential density environment compared to a high or low residential building density (see Table 2 and Fig 3). No significant difference in effect of evenness of the cycle path surface emerged for comparisons of a low to a high residential density environment.
Fig 3. Interaction effect between the macro-environment and the evenness of the cycle path surface.
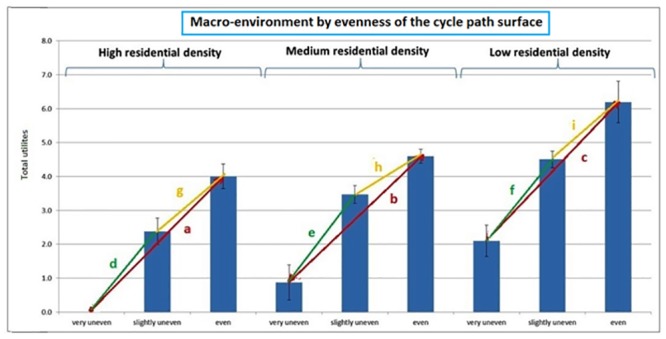
Note: a, b, c, d, e, f, g, h, i = the distance between the total utilities; * = p<0.05; a > b*, a < c, b < c*, d < e*, d < f, e > f*, g < h*, g < i, h < i*.
Table 2. Interaction effect between the macro-environment and evenness of the cycle path surface, speed limit and type of separation between cycle path and motorized traffic.
| Macro-environment and evenness of the cycle path surface | |||||||||
| Evenness | Very uneven—even | Very uneven—slightly uneven | Even—slightly uneven | ||||||
| Macro | High—Med | High—Low | Med—Low | High—Med | High—Low | Med—Low | High—Med | High—Low | Med—Low |
| MEAN | -0.28 | 0.09 | 0.37 | 0.21 | 0.02 | -0.19 | -0,49 | 0,07 | 0,57 |
| SD | 0.93 | 1.53 | 1.10 | 1.06 | 1.08 | 1.44 | 0,95 | 1,15 | 1,03 |
| -95% CI | -0.37 | -0.06 | 0.27 | 0.11 | -0.09 | -0.33 | -0,59 | -0,04 | 0,46 |
| +95% CI | -0.19 | 0.25 | 0.48 | 0.32 | 0.13 | -0.05 | -0,40 | 0,19 | 0,67 |
| Fig 3 | a > b* | a < c | b < c* | d < e* | d < f | e > f* | g < h* | g < i | h < i* |
| Macro-environment and speed limit | |||||||||
| Speed limit | 70 km/h—30 km/h | 70 km/h—50 km/h | 30 km/h—50 km/h | ||||||
| Macro | High—Med | High—Low | Med—Low | High—Med | High—Low | Med—Low | High—Med | High—Low | Med—Low |
| MEAN | -0,62 | 0,19 | 0,81 | -4,19 | 0,11 | 4,30 | 3,57 | 0,08 | -3,49 |
| SD | 0,96 | 0,91 | 1,21 | 1,94 | 1,24 | 1,80 | 1,96 | 0,58 | 2,03 |
| -95% CI | -0,72 | 0,10 | 0,69 | -4,38 | -0,02 | 4,12 | 3,37 | 0,02 | -3,69 |
| +95% CI | -0,53 | 0,28 | 0,93 | -4,00 | 0,23 | 4,47 | 3,76 | 0,14 | -3,28 |
| Fig 4 | j > k* | j < l* | k < l* | m > n* | m < o | n < o* | p > q* | p < r* | q > r* |
| Macro-environment and type of separation between cycle path and motorized traffic | |||||||||
| Type of separation | No separation—hedge | No separation—curbe | Hedge—curb | ||||||
| Macro | High—Med | High—Low | Med—Low | High—Med | High—Low | Med—Low | High—Med | High—Low | Med—Low |
| MEAN | -0.25 | -0.10 | 0.15 | 0.85 | 0.46 | -0.38 | -1.09 | -0.56 | 0.54 |
| SD | 1.43 | 2.11 | 1.59 | 1.41 | 1.71 | 2.55 | 0.99 | 1.66 | 1.63 |
| -95% CI | -0.39 | -0.30 | -0.01 | 0.71 | 0.29 | -0.64 | -1.19 | -0.72 | 0.37 |
| +95% CI | -0.10 | 0.11 | 0.31 | 0.99 | 0.63 | -0.13 | -0.99 | -0.39 | 0.70 |
| Fig 5 | s > t* | s > u | t < u | v < w* | v < x* | w > x* | y > z1 * | y < z² * | z1 < z2 * |
Interaction between macro-environment and speed limit
Fig 4 shows the overall utilities for streets differing in macro-environment and speed limit. In each macro-environment the most strict speed limit (30 km/h) was preferred first and secondly 50 km/h above 70 km/h. Only in a medium residential density environment the participants preferred a speed limit of 70 km/h above 50 km/h. The positive effect of a speed limit of 30 km/h compared to 70 km/h or 50 km/h was largest in a low residential density environment, except for the effect of a speed limit of 30 km/h compared to 50 km/h which was stronger in a medium residential density environment (see Table 2 and Fig 4).
Fig 4. Interaction effect between the macro-environment and speed limit.
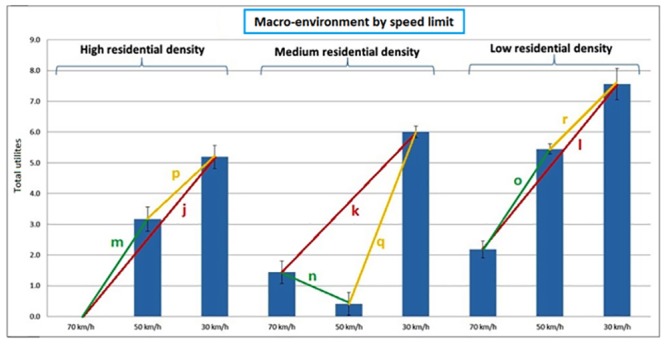
Note: j, k, l, m, n, o, p, q, r = the distance between the total utilities; * = p<0.05; j > k*, j < l*, k < l*, m > n*, m < o, n < o*, p > q*, p < r*, q > r*.
Interaction between macro-environment and type of separation between cycle path and motorized traffic
Fig 5 shows the overall utilities for streets differing in macro-environment and type of separation between cycle path and motorized traffic. In each macro-environment, participants preferred first a hedge as separation between cycle path and motorized traffic and secondly a curb above a cycle path located on the street. However, the strength of the effect of the type of separation differed between the different macro-environments. The effect of a hedge instead of no separation was larger in a high compared to a medium residential density environment. There was no significant difference of this effect between a high compared to low and a low compared to medium residential density environment. Moreover the effect of a curb instead of no separation was largest in a medium and also greater in a low compared to high residential density environment (see Table 2 and Fig 5).
Fig 5. Interaction effect between the macro-environment and type of separation between cycle path and motorized traffic.
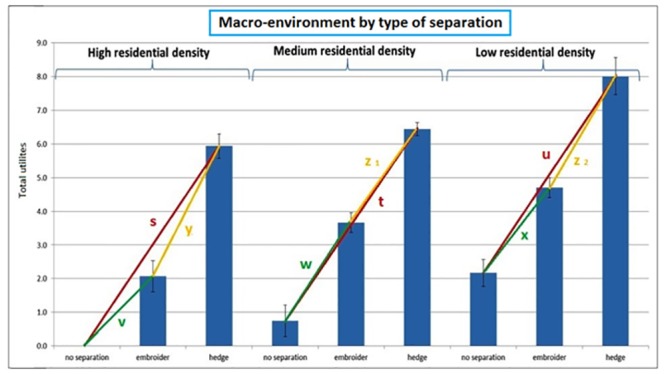
Note: s, t, u, v, w, x, y, z1, z2 = the distance between the total utilities; * = p<0.05; s > t*, s > u, t < u, v < w*, v < x*, w > x*, y > z1*, y < z2*, z1 < z2*.
Discussion
This is the first controlled experiment to examine the effect of manipulating micro-environmental factors on the environment’s perceived street’s appeal for adults’ bicycle transport in different street settings or macro-environments. The analyses indicate that the effect of micro-environmental modifications may well generalize to physical environmental interventions in different macro-environments. Although we found several statistically significant interactions between the micro-environmental factors and the macro-environmental factor, the direction of the effects across the different macro-environments did not differ, only the magnitude of the effect did.
There was no significant difference in relative importance between the three micro-environmental factors, independent of the macro-environment. Thus, all three micro-environmental factors were equally important for the street’s appeal for bicycle transport. However, within each macro-environment, small differences in relative importance of the micro-environmental factors were detected. The presence of a separation was more important than evenness of the cycle path surface in all three macro-environments. In a low residential density environment, a separation was also more important than a speed limit and in a medium residential density environment, the presence of a speed limit was more important than evenness of the cycle path surface. Otherwise, the relative importance of the three micro-environmental factors was similar in each macro-environment. Since the real environment consists of a large number of micro-environmental factors, it is essential for future research to include all possible environmental factors in photograph experiments in order to make the best simulation of the real environment. However, this research step was necessary because it would be unmanageable to manipulate all possible micro-environmental factors, together with different macro-environmental factors in the photographs.
The current study also showed that the macro-environment was less important for the street’s appeal for bicycle transport than the three micro-environmental factors. This suggests that each improvement in a micro-environmental factor is a promising practical direction for interventions. However, our finding that participants preferred a low to either a medium or high residential density environment for bicycle transport differs from previous cross-sectional studies. Those studies indicated that certain macro-environment factors, including walkability, access to shops/services/work and degree of urbanization with bicycle transport, are associated with more bicycle transport [27]. People living in more urbanized areas or in a highly walkable environment tend to do more bicycle transport than people living in less walkable environments [27,54,55]. Although a more walkable environment probably encourages bicycling through the short access to shops/services/work, the current study shows that the view of a less walkable environment is more appealing for bicycling. It is possible that these contrasting findings result from the standardized 10 minute travel time in the present study. Concerning walkability, the distance to a destination is a crucial aspect for transportation behavior and in low dense areas, travel distances are usually larger than 10 minutes. Adding the effect of distance as an additional factor to the choice tasks, could be a good research question for future research. The discrepancy between our finding and previous findings may also result from differences between the perception of the street’s appeal for bicycle transport, the intention to cycle and the actual bicycling behavior [56,57].
Examination of the importance of the levels within each environmental factor (main effects) revealed that an even cycle path surface, a speed limit of 30 km/h, and a hedge between cycle path and motorized traffic were most preferred to middle-aged adults for the street’s appeal for bicycle transport along the depicted environments. A previous study using manipulated photographs yielded similar results [39]. The present study confirmed these results but for different macro-environments, which was the ultimate goal in this research. In addition, previous cross-sectional studies found evenness of the cycle path surface [58,59], speed limit [45,60] and type of separation between cycle path and motorized traffic [59,61,62] to be related to bicycle transport. Our results indicated that small changes in the micro-environmental factors can help to increase the street’s appeal for bicycle transport in various macro-environments. Since in this study only a selection of three micro-environmental factors and not all potentially relevant micro-environmental factors (e.g., general upkeep of the environment, presence of vegetation, traffic volume) were used in these experiments, further research is needed to determine the effect of all those factors.
The main strength of this study is the used innovative methodology that enables to establish causal relationships between environmental manipulations and the street’s appeal for bicycle transport. Because it is very difficult and expensive to investigate the effects of changing real environments on actual bicycling behavior, this study used a cost-effective approach by manipulating photographs of environments. However, further research in real-life settings is warranted to find out whether current findings can be replicated when studying the effects of real environmental modifications on actual bicycling behavior. Furthermore, these causal relationships cannot be recorded by more recent methodologies like photo-elicitation [63] (requiring participants to take photo images of their journey and revealing actual preferences) or GPS [64] (indicates where an individual is active). These methodologies could help to record changes in behavior as a result of natural experiments, but could not give information about the importance of micro- and macro-environmental factors. The current study adds to the literature, as it is still unclear what type of infrastructure is required to encourage bicycle transport. This might be due to the fact that environmental factors have not been specified enough to elicit associations between bicycle transport and built environment in previous studies [65]. In contrast, our study focuses on small, amenable micro-environmental factors, which are feasible to modify during interventions. Furthermore, it remains important to keep in mind that interventions should not focus on only one particular determinant of active transport, such as the built environment. Evidence shows that multi-layered interventions are most successful to initiate and sustain behavior change effectively [7,65].
Future research can benefit from some of the strengths of the present approach: the use of different macro-environments to examine the effect of manipulating micro-environmental factors, testing responses to photographs rather than verbal descriptions of places, the use of manipulated simulations to create a controlled experiment, and the use of a choice-based conjoint method (CBC), which allow testing for effects without presenting all of the possible combinations. The study also allowed to test more items that were combined at the same time. Such methodology can answer questions about effects of environmental changes on the street’s appeal for adults’ bicycle transport. The same method can also be used for different subgroups like children and senior citizens, and perhaps can also be used for other behaviors such as walking or general physical activity. Consequently, these controlled simulations can provide ready-made advice for natural experiments, which can be considered a logical next step in this study project. Findings obtained from research using manipulated photographs could inform physical environmental interventions in real life settings about which environmental factors to modify in different macro-environments.
There are, however, some limitations that have to be acknowledged. First, the present study assessed effects on the street’s appeal for bicycle transport and, not actual bicycling behavior. Consequently, studies are needed to examine the effects of changing real environments on bicycling behavior in various contexts. Second, the present study focused on three micro-environmental factors. Although previous research had indicated them as important factors, perhaps other factors would have effects alone or in interaction with other factors. Future research should identify and include all potentially relevant micro-environmental factors and investigate their interactions. Third, a limitation of using color photographs is the two-dimensional character or the lack of movement in the environment. In real life, people notice different things in the environment depending on their speed of travel. Manipulating computer-generated virtual walkthrough environments (three-dimensional) could offer a solution for this problem [66]. Fourth, our sampling yielded a sample of well-educated adults with 65.8% having a tertiary education degree. This is much more than the statistics for the Flemish population indicate with 28.1% having a tertiary degree [67]. Future research needs to establish how well the findings apply to other less educated groups. A study from Scheepers et al. (2013) [68] indicated a higher use of active transport modes by persons with an university or college degree. Because there are differences in bicycling behaviors between individuals with a different individual educational level, future research should also investigate the moderating effects of other personal determinants (such as gender, age and employment) on the relationships between manipulating the environment and the street’s appeal for bicycle transport as well [22].
Conclusions
The present study used different macro-environments to examine the effect of manipulating micro-environmental factors. Our findings indicate that in each different macro-environment (i.e. low, medium and high residential density), middle-aged adults preferred a speed limit of 30 km/h, an even cycle path and a hedge as separation between motorized traffic and the cycle path compared to a speed limit of 50 or 70 km/h, a slightly uneven or uneven cycle path surface and a curb as separation or no separation between motorized traffic and the cycle path. The direction of these effects were all the same in each macro-environment, only the magnitude of the effects differed between the different macro-environments. Our results suggest that irrespective of the macro-environment, the same micro-environmental factors are preferred in middle-aged adults concerning the street’s appeal for bicycle transport. Consequently, no other physical environmental factors might be modified in different street settings. Any small changes to the micro-environmental factors (e.g. changing the speed limits from 50 km/h to 30 km/h) can effectively help to increase the street’s appeal for bicycle transport among adults. These controlled simulations could inform environmental interventions in real life settings to modify similar micro-environmental factors in different macro-environments. However, these findings need to be confirmed by on-site research.
Supporting Information
(PDF)
Acknowledgments
AG, JVC, VVH and DVD are supported by a grant from the Fund for Scientific Research Flanders (FWO). The authors would like to thank Daphne Reinehr for developing the photographs.
Data Availability
All relevant data are within the paper.
Funding Statement
AG, JVC, VVH and DVD are supported by a grant from the Fund for Scientific Research Flanders (FWO) (grant numbers: JVC: 11N0313N AG: GA11111N VVH: 11O3115N DVD: FWO12/PDO/158; www.fwo.be). The funders had no role in study design, data collection and analysis, decision to publish, or preparation of the manuscript.
References
- 1.World Health Organization (2010) Global Recommendations on Physical Activity for Health. Available: http://whqlibdoc.who.int/publications/2010/9789241599979_eng.pdf. [PubMed]
- 2.World Health Organization (2008) Insufficient physical activity. Available: http://www.who.int/gho/ncd/risk_factors/physical_activity/en/.
- 3. Rudinger G, Donaghy K, Poppelreuter S (2006) Societal trends, mobility behaviour and sustainable transport in Europe and North America. Available: http://www.ejtir.tudelft.nl/issues/2006_01/pdf/2006_01_04.pdf. [DOI] [PMC free article] [PubMed] [Google Scholar]
- 4. Janssens D, Declercq K, Wets G (2014) Onderzoek Verplaatsingsgedrag Vlaanderen 4.5 (2012–2013). Instituur voor Mobiliteit: 116 Available: http://www.mobielvlaanderen.be/pdf/ovg45/ovg45-analyse-globaal.pdf. [Google Scholar]
- 5. Wanner M, Götschi T, Martin-Diener E, Kahlmeier S, Martin BW (2012) Active transport, physical activity, and body weight in adults: a systematic review. American journal of preventive medicine 42: 493–502. Available: http://www.ncbi.nlm.nih.gov/pubmed/22516490. Accessed 6 May 2014. 10.1016/j.amepre.2012.01.030 [DOI] [PubMed] [Google Scholar]
- 6. Oja P, Titze S, Bauman a, de Geus B, Krenn P, Reger-Nash B, et al. (2011) Health benefits of cycling: a systematic review. Scandinavian journal of medicine & science in sports 21: 496–509. Available: http://www.ncbi.nlm.nih.gov/pubmed/21496106. Accessed 24 May 2013. [DOI] [PubMed] [Google Scholar]
- 7.World health organization (2009) Interventions on diet and physical activity: what works (summary report). Available: http://www.who.int/dietphysicalactivity/summary-report-09.pdf. [PubMed]
- 8. Rojas-Rueda D, de Nazelle a., Tainio M, Nieuwenhuijsen MJ (2011) The health risks and benefits of cycling in urban environments compared with car use: health impact assessment study. Bmj 343: d4521–d4521. Available: http://www.bmj.com/cgi/doi/10.1136/bmj.d4521. Accessed 24 May 2013. 10.1136/bmj.d4521 [DOI] [PMC free article] [PubMed] [Google Scholar]
- 9. De Hartog JJ, Boogaard H, Nijland H, Hoek G (2010) Do the health benefits of cycling outweigh the risks? Environmental health perspectives 118: 1109–1116. Available: http://www.pubmedcentral.nih.gov/articlerender.fcgi?artid=2920084&tool=pmcentrez&rendertype=abstract. Accessed 11 June 2013. 10.1289/ehp.0901747 [DOI] [PMC free article] [PubMed] [Google Scholar]
- 10. Rissel CE (2009) Active travel: a climate change mitigation strategy with co-benefits for health. New South Wales public health bulletin 20: 10–13. Available: http://www.ncbi.nlm.nih.gov/pubmed/19261210. [DOI] [PubMed] [Google Scholar]
- 11. Woodcock J, Edwards P, Tonne C, Armstrong BG, Ashiru O, Banister D, et al. (2009) Public health benefits of strategies to reduce greenhouse-gas emissions: urban land transport. Lancet 374: 1930–1943. Available: http://www.ncbi.nlm.nih.gov/pubmed/19942277. Accessed 16 August 2013. 10.1016/S0140-6736(09)61714-1 [DOI] [PubMed] [Google Scholar]
- 12. Woodcock J, Banister D, Edwards P, Prentice A, Roberts I (2007) Energy and health 3—Energy and transport. Lancet 370: 1078–1088. [DOI] [PubMed] [Google Scholar]
- 13.Departement of Health- Physical activity- Health improvement and prevention (2004) At least five a week. Available: http://www.bhfactive.org.uk/sites/Exercise-Referral-Toolkit/downloads/resources/cmos-report-at-least-five-a-week.pdf.
- 14. Pucher J, Buehler R, Bassett DR, Dannenberg AL (2010) Walking and cycling to health: a comparative analysis of city, state, and international data. American journal of public health 100: 1986–1992. Available: http://www.pubmedcentral.nih.gov/articlerender.fcgi?artid=2937005&tool=pmcentrez&rendertype=abstract. Accessed 31 May 2013. 10.2105/AJPH.2009.189324 [DOI] [PMC free article] [PubMed] [Google Scholar]
- 15. Rabl A, de Nazelle A (2012) Benefits of shift from car to active transport. Transport Policy 19: 121–131. Available: http://linkinghub.elsevier.com/retrieve/pii/S0967070X11001119. Accessed 24 May 2013. [Google Scholar]
- 16. Gaffron P (2003) The implementation of walking and cycling policies in British local authorities. Transport Policy 10: 235–244. Available: http://linkinghub.elsevier.com/retrieve/pii/S0967070X03000246. Accessed 21 November 2014. [Google Scholar]
- 17. Pucher J, Dill J, Handy S (2010) Infrastructure, programs, and policies to increase bicycling: an international review. Preventive medicine 50 Suppl 1: S106–S125. Available: http://www.ncbi.nlm.nih.gov/pubmed/19765610. Accessed 10 July 2014. 10.1016/j.ypmed.2009.07.028 [DOI] [PubMed] [Google Scholar]
- 18. Buehler R, Pucher J (2012) Walking and Cycling in Western Europe and the United States. TR NEWS 280 Available: http://policy.rutgers.edu/faculty/pucher/TRNWesternEurope.pdf. [Google Scholar]
- 19.Commission of the European Communities (2007) GREEN PAPER Towards a new culture for urban mobility. Available: http://ec.europa.eu/transport/clean/green_paper_urban_transport/doc/2007_09_25_gp_urban_mobility_en.pdf.
- 20. Sallis JF, Cervero RB, Ascher W, Henderson K a, Kraft MK, Kerr J, et al. (2006) An ecological approach to creating active living communities. Annual review of public health 27: 297–322. Available: http://www.ncbi.nlm.nih.gov/pubmed/16533119. Accessed 4 June 2013. [DOI] [PubMed] [Google Scholar]
- 21. Vandenbulcke G, Thomas I, de Geus B, Degraeuwe B, Torfs R, Meeusen R, et al. (2009) Mapping bicycle use and the risk of accidents for commuters who cycle to work in Belgium. Transport Policy 16: 77–87. Available: http://linkinghub.elsevier.com/retrieve/pii/S0967070X09000407. Accessed 13 September 2013. [Google Scholar]
- 22. Jongeneel-Grimen B, Busschers W, Droomers M, van Oers H a M, Stronks K, Kunst AE, et al. (2013) Change in neighborhood traffic safety: does it matter in terms of physical activity? PloS one 8: e62525 Available: http://www.pubmedcentral.nih.gov/articlerender.fcgi?artid=3642189&tool=pmcentrez&rendertype=abstract. Accessed 10 December 2013. 10.1371/journal.pone.0062525 [DOI] [PMC free article] [PubMed] [Google Scholar]
- 23. Davison KK, Lawson CT (2006) Do attributes in the physical environment influence children’s physical activity? A review of the literature. International Journal of Behavioral Nutrition & Physical Activity 3: 19. [DOI] [PMC free article] [PubMed] [Google Scholar]
- 24. Van Dyck D, Cerin E, Conway TL, De Bourdeaudhuij I, Owen N, Kerr J, et al. (2012) Perceived neighborhood environmental attributes associated with adults’ transport-related walking and cycling: Findings from the USA, Australia and Belgium. The international journal of behavioral nutrition and physical activity 9: 70 Available: http://www.pubmedcentral.nih.gov/articlerender.fcgi?artid=3489620&tool=pmcentrez&rendertype=abstract. Accessed 2 May 2014. 10.1186/1479-5868-9-70 [DOI] [PMC free article] [PubMed] [Google Scholar]
- 25. Swinburn B, Egger G, Ph D, Raza F (1999) Dissecting Obesogenic Environments : The Development and Application of a Framework for Identifying and Prioritizing Environmental Interventions for Obesity 1 570: 563–570. [DOI] [PubMed] [Google Scholar]
- 26. Cain KL, Millstein R a, Sallis JF, Conway TL, Gavand K a, Frank LD, et al. (2014) Contribution of streetscape audits to explanation of physical activity in four age groups based on the Microscale Audit of Pedestrian Streetscapes (MAPS). Social science & medicine (1982) 116: 82–92. Available: http://www.ncbi.nlm.nih.gov/pubmed/24983701. Accessed 27 March 2015. [DOI] [PMC free article] [PubMed] [Google Scholar]
- 27. Van Holle V, Deforche B, Van Cauwenberg J, Goubert L, Maes L, Van de Weghe N, et al. (2012) Relationship between the physical environment and different domains of physical activity in European adults: a systematic review. BMC public health 12: 807 Available: http://www.pubmedcentral.nih.gov/articlerender.fcgi?artid=3507898&tool=pmcentrez&rendertype=abstract. Accessed 5 June 2013. 10.1186/1471-2458-12-807 [DOI] [PMC free article] [PubMed] [Google Scholar]
- 28. McCormack G, Giles-Corti B, Lange a, Smith T, Martin K, Pikora TJ (2004) An update of recent evidence of the relationship between objective and self-report measures of the physical environment and physical activity behaviours. Journal of science and medicine in sport / Sports Medicine Australia 7: 81–92. Available: http://www.ncbi.nlm.nih.gov/pubmed/15214606. [DOI] [PubMed] [Google Scholar]
- 29. Foster CE, Panter JR, Wareham NJ (2011) Assessing the impact of road traffic on cycling for leisure and cycling to work. The international journal of behavioral nutrition and physical activity 8: 61 Available: http://www.pubmedcentral.nih.gov/articlerender.fcgi?artid=3127970&tool=pmcentrez&rendertype=abstract. Accessed 29 October 2013. 10.1186/1479-5868-8-61 [DOI] [PMC free article] [PubMed] [Google Scholar]
- 30. Ferdinand AO, Sen B, Rahurkar S, Engler S, Menachemi N (2012) The Relationship Between Built Environments and Physical Activity : A Systematic Review. 102: 7–13. 10.2105/AJPH.2012.300740 [DOI] [PMC free article] [PubMed] [Google Scholar]
- 31. McCormack GR, Shiell A (2011) In search of causality: a systematic review of the relationship between the built environment and physical activity among adults. The international journal of behavioral nutrition and physical activity 8: 125 Available: http://www.pubmedcentral.nih.gov/articlerender.fcgi?artid=3306205&tool=pmcentrez&rendertype=abstract. Accessed 4 June 2013. 10.1186/1479-5868-8-125 [DOI] [PMC free article] [PubMed] [Google Scholar]
- 32. Sallis JF, Bowles HR, Bauman A, Ainsworth BE, Bull FC, Craig CL, et al. (2009) Neighborhood environments and physical activity among adults in 11 countries. American journal of preventive medicine 36: 484–490. Available: http://www.ncbi.nlm.nih.gov/pubmed/19460656. Accessed 5 June 2013. 10.1016/j.amepre.2009.01.031 [DOI] [PubMed] [Google Scholar]
- 33. Carpiano RM (2009) Come take a walk with me: the “go-along” interview as a novel method for studying the implications of place for health and well-being. Health & place 15: 263–272. Available: http://www.ncbi.nlm.nih.gov/pubmed/18606557. Accessed 24 May 2013. [DOI] [PubMed] [Google Scholar]
- 34. Spittaels H, Foster C, Oppert J-M, Rutter H, Oja P, Sjöström M, et al. (2009) Assessment of environmental correlates of physical activity: development of a European questionnaire. The international journal of behavioral nutrition and physical activity 6: 39 Available: http://www.pubmedcentral.nih.gov/articlerender.fcgi?artid=2713198&tool=pmcentrez&rendertype=abstract. Accessed 20 November 2014. 10.1186/1479-5868-6-39 [DOI] [PMC free article] [PubMed] [Google Scholar]
- 35. Bauman AE, Reis RS, Sallis JF, Wells JC, Loos RJF, Martin BW (2012) Correlates of physical activity: why are some people physically active and others not? Lancet 380: 258–271. Available: http://www.ncbi.nlm.nih.gov/pubmed/22818938. Accessed 11 July 2014. 10.1016/S0140-6736(12)60735-1 [DOI] [PubMed] [Google Scholar]
- 36. Nasar JL (2008) Assessing perceptions of environments for active living. American journal of preventive medicine 34: 357–363. Available: http://www.ncbi.nlm.nih.gov/pubmed/18374252. Accessed 24 May 2013. 10.1016/j.amepre.2008.01.013 [DOI] [PubMed] [Google Scholar]
- 37. Wells NM, Ashdown SP, Davies EHS, Cowett FD, Yang Y (2007) Environment, Design, and Obesity: Opportunities for Interdisciplinary Collaborative Research. Environment and Behavior 39: 6–33. Available: http://eab.sagepub.com/cgi/doi/10.1177/0013916506295570. Accessed 13 June 2013. [Google Scholar]
- 38. Van Cauwenberg J, Van Holle V, De Bourdeaudhuij I, Clarys P, Nasar J, Salmon J, et al. (2014) Using manipulated photographs to identify features of streetscapes that may encourage older adults to walk for transport. PloS one 9: e112107 Available: http://www.ncbi.nlm.nih.gov/pubmed/25396732. Accessed 20 November 2014. 10.1371/journal.pone.0112107 [DOI] [PMC free article] [PubMed] [Google Scholar]
- 39. Mertens L, Van Holle V, De Bourdeaudhuij I, Deforche B, Salmon J, Nasar J, et al. (2014) The effect of changing micro-scale physical environmental factors on an environment’s invitingness for transportation cycling in adults: an exploratory study using manipulated photographs. The international journal of behavioral nutrition and physical activity 11: 88 Available: http://www.ncbi.nlm.nih.gov/pubmed/25135666. Accessed 21 November 2014. 10.1186/s12966-014-0088-x [DOI] [PMC free article] [PubMed] [Google Scholar]
- 40.Lenders S, Lauwers L, Vervloet D, Kerselaers E (2006) Afbakening van het Vlaamse platteland, een statistische analyse. Available: http://www2.vlaanderen.be/landbouw/downloads/volt/38.pdf.
- 41. Portney LG, Watkins MP (2009) Foundations of Clinical Research—Applications to practice Third. United States of America: Pearson Education. [Google Scholar]
- 42.Adobe Systems Incorporated (2013) ADOBE PHOTOSHOP CC. Available: http://wwwimages.adobe.com/content/dam/Adobe/en/devnet/photoshop/pdfs/photoshop-cc-scripting-guide.pdf.
- 43. Van Holle V, Van Cauwenberg J, Deforche B, Goubert L, Maes L, Nasar J, et al. (2014) Environmental invitingness for transport-related cycling in middle-aged adults: A proof of concept study using photographs. Transportation Research Part A: Policy and Practice 69: 432–446. Available: http://linkinghub.elsevier.com/retrieve/pii/S0965856414002201. Accessed 5 December 2014. [Google Scholar]
- 44. Ghekiere A, Van Cauwenberg J, de Geus B, Clarys P, Cardon G, Salmon J, et al. (2014) Critical environmental factors for transportation cycling in children: a qualitative study using bike-along interviews. PloS one 9: e106696 Available: http://www.pubmedcentral.nih.gov/articlerender.fcgi?artid=4175075&tool=pmcentrez&rendertype=abstract. Accessed 20 November 2014. 10.1371/journal.pone.0106696 [DOI] [PMC free article] [PubMed] [Google Scholar]
- 45. Pucher J, Buehler R (2008) Making Cycling Irresistible: Lessons from The Netherlands, Denmark and Germany. Transport Reviews 28: 495–528. Available: http://www.tandfonline.com/doi/abs/10.1080/01441640701806612. Accessed 24 May 2013. [Google Scholar]
- 46. Craig CL, Marshall AL, Sjöström M, Bauman AE, Booth ML, Ainsworth BE, et al. (2003) International physical activity questionnaire: 12-country reliability and validity. Medicine and science in sports and exercise 35: 1381–1395. Available: http://www.ncbi.nlm.nih.gov/pubmed/12900694. Accessed 29 May 2013. [DOI] [PubMed] [Google Scholar]
- 47. Orme BK (2009) Getting Started with Conjoint Analysis: Strategies for Product Design and Pricing Research. Resarch publishers, Madison, WI. [Google Scholar]
- 48. Massiani J, Rosato P (2008) Using conjoint analysis to investigate preferences of inhabitants for the future of a greyfield area : an application to the Old Port in Trieste. 39: 59–80. [Google Scholar]
- 49. Alves S, Aspinall P a., Thompson CW, Sugiyama T, Brice R, Vickers A (2008) Preferences of older people for environmental attributes of local parks: The use of choice-based conjoint analysis. Facilities 26: 433–453. Available: http://www.emeraldinsight.com/10.1108/02632770810895705. Accessed 15 August 2013. [Google Scholar]
- 50. Nordh H, Alalouch C, Hartig T (2011) Assessing restorative components of small urban parks using conjoint methodology. Urban Forestry & Urban Greening 10: 95–103. Available: http://linkinghub.elsevier.com/retrieve/pii/S1618866711000021. Accessed 27 May 2014. [Google Scholar]
- 51. Sawtooth Software Inc. (2013) The CBC System for Choice-Based Conjoint Analysis: 1–27. Available: https://sawtoothsoftware.com/download/techpap/cbctech.pdf. [Google Scholar]
- 52. Multon KD (2012) Interrater Reliability. Encylopedia of Research Design: 627–629. Available: http://www.bibb.k12.ga.us/cms/lib01/GA01000598/Centricity/Domain/105/Interrater/ReliabilityArticle_1.pdf. [Google Scholar]
- 53. Allenby GM, Arora N, Ginter JL (2014) On the of Demand Heterogeneity. 35: 384–389. Available: http://www.jstor.org/stable/3152035?origin=JSTOR-pdf&seq=1#page_scan_tab_contents. [Google Scholar]
- 54. Grasser G, Van Dyck D, Titze S, Stronegger W (2013) Objectively measured walkability and active transport and weight-related outcomes in adults: a systematic review. International journal of public health 58: 615–625. Available: http://www.ncbi.nlm.nih.gov/pubmed/23224518. Accessed 27 May 2014. 10.1007/s00038-012-0435-0 [DOI] [PubMed] [Google Scholar]
- 55. Owen N, De De Bourdeaudhuij I, Sugiyama T, Leslie E, Cerin E, Van Dyck D et al. (2010) Bicycle use for transport in an Australian and a Belgian city: associations with built-environment attributes. Journal of urban health : bulletin of the New York Academy of Medicine 87: 189–198. Available: http://www.pubmedcentral.nih.gov/articlerender.fcgi?artid=2845830&tool=pmcentrez&rendertype=abstract. Accessed 27 May 2014. [DOI] [PMC free article] [PubMed] [Google Scholar]
- 56. Danner UN, Aarts H, de Vries NK (2008) Habit vs. intention in the prediction of future behaviour: the role of frequency, context stability and mental accessibility of past behaviour. The British journal of social psychology / the British Psychological Society 47: 245–265. Available: http://www.ncbi.nlm.nih.gov/pubmed/17678574. Accessed 23 May 2014. [DOI] [PubMed] [Google Scholar]
- 57. Moudon AV, Lee C, Cheadle AD, Collier CW, Johnson D, Schmid TL, et al. (2005) Cycling and the built environment, a US perspective. Transportation Research Part D: Transport and Environment 10: 245–261. Available: http://linkinghub.elsevier.com/retrieve/pii/S1361920905000167. Accessed 25 May 2014. [Google Scholar]
- 58. Bidordinova A, Member S (2010) MOTIVATORS AND BARRIERS TO UTILITARIAN CYCLING IN DOWNTOWN: 1–15. [Google Scholar]
- 59. Winters M, Davidson G, Kao D, Teschke K (2010) Motivators and deterrents of bicycling: comparing influences on decisions to ride. Transportation 38: 153–168. Available: http://link.springer.com/10.1007/s11116-010-9284-y. Accessed 16 August 2013. [Google Scholar]
- 60. Titze S, Giles-Corti B, Knuiman MW, Pikora TJ, Timperio a, Bull FC, et al. (2010) Associations Between Intrapersonal and Neighborhood Environmental Characteristics and Cycling for Transport and Recreation in Adults: Baseline Results From the RESIDE Study. J Phys Act Health 7: 423–431. [DOI] [PubMed] [Google Scholar]
- 61. Fraser SDS, Lock K (2010) Cycling for transport and public health: a systematic review of the effect of the environment on cycling. European journal of public health 21: 738–743. Available: http://www.ncbi.nlm.nih.gov/pubmed/20929903. Accessed 7 August 2013. 10.1093/eurpub/ckq145 [DOI] [PubMed] [Google Scholar]
- 62. Sallis JF, Conway TL, Dillon LI, Frank LD, Adams MA, Cain KL, et al. (2013) Environmental and demographic correlates of bicycling. Preventive medicine 57: 456–460. 10.1016/j.ypmed.2013.06.014 [DOI] [PMC free article] [PubMed] [Google Scholar]
- 63. Ogilvie D, Griffin S, Jones A, Mackett R, Guell C, Panter J, et al. (2010) Commuting and health in Cambridge: a study of a “natural experiment” in the provision of new transport infrastructure. BMC public health 10: 703 Available: http://www.pubmedcentral.nih.gov/articlerender.fcgi?artid=2999608&tool=pmcentrez&rendertype=abstract. Accessed 16 December 2014. 10.1186/1471-2458-10-703 [DOI] [PMC free article] [PubMed] [Google Scholar]
- 64. Krenn PJ, Titze S, Oja P, Jones A, Ogilvie D (2013) Use of Global Positioning Systems to Study Physical Activity and the Environment : American Journal of Preventive Medicine 41: 1–20. Available: http://www.ncbi.nlm.nih.gov/pmc/articles/PMC3821057/pdf/emss-53972.pdf. [DOI] [PMC free article] [PubMed] [Google Scholar]
- 65. Badland H, Knuiman M, Hooper P, Giles-Corti B (2013) Socio-ecological predictors of the uptake of cycling for recreation and transport in adults: results from the RESIDE study. Preventive medicine 57: 396–399. Available: http://www.ncbi.nlm.nih.gov/pubmed/23792583. Accessed 20 November 2014. 10.1016/j.ypmed.2013.06.015 [DOI] [PubMed] [Google Scholar]
- 66. Cubukcu E, Nasar JL (2005) Influence of physical characteristics of routes on distance cognition in virtual environments. Environment and Planning B: Planning and Design 32: 777–785. Available: http://www.envplan.com/abstract.cgi?id=b31191. Accessed 6 September 2013. [Google Scholar]
- 67.Belgian Federal Government (2013) Statistics Belgium. Available: http://statbel.fgov.be/.
- 68. Scheepers E, Wendel-Vos W, van Kempen E, Panis LI, Maas J, Stipdonk H, et al. (2013) Personal and environmental characteristics associated with choice of active transport modes versus car use for different trip purposes of trips up to 7.5 kilometers in The Netherlands. PloS one 8: e73105 Available: http://www.pubmedcentral.nih.gov/articlerender.fcgi?artid=3764150&tool=pmcentrez&rendertype=abstract. Accessed 18 November 2014. 10.1371/journal.pone.0073105 [DOI] [PMC free article] [PubMed] [Google Scholar]
Associated Data
This section collects any data citations, data availability statements, or supplementary materials included in this article.
Supplementary Materials
(PDF)
Data Availability Statement
All relevant data are within the paper.