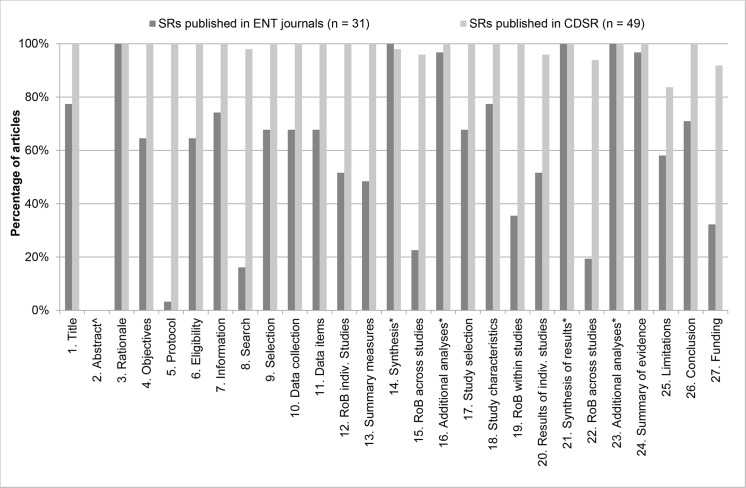
Fig 2. Number of adequately reported PRISMA items per journal type.
The percentage of articles that adequately reported PRISMA items is plotted per journal type (ENT journals [dark grey bars]-vs- CDSR [light grey bars]). For exact percentages, see Table 2. ^ Item 2 is scored separately, see Fig 3. Items 14, 16, 21 and 23 are optional items. For details on scoring, see S2 File.

