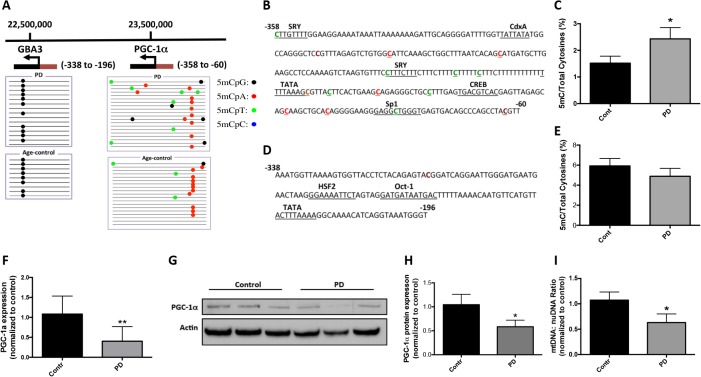
Fig 1. Methylation analysis of the PGC−1α promoter in PD patients and age-matched controls.
A. Graphical presentation of the genomic localization of the PGC−1α and GBA3 promoters on chromosome 4. The transcription start site (arrow), transcription units (black box) and sequenced promoters (red box) are shown for both genes. GBA3 is an adjacent to the PGC−1α gene. Genomic DNA was isolated from substantia nigra from PD and age-matched controls for bisulfite sequencing. Visualization of the bisulfite sequencing results for GBA3 and the PGC−1α promoters were completed using MethTools 3.0. B. Methylation sequencing region in the PGC−1α promoter. Important transcription factor binding sites are underlined. Methylated CpGs are highlighted in brown, CpAs in red, CpTs in green and CpCs in blue. C. Quantitation of cytosine methylation levels of the PGC−1α promoter. The percentage of cytosine methylation in the PGC−1α promoter is 1.52 in control and 2.43 in PD respectively, and they are significantly different (p = 0.0368). D. Methylation sequencing region in the GBA3 promoter. Important transcription factor binding sites are underlined. Methylated CpGs are highlighted in brown. E. Quantitation of cytosine methylation levels of the GBA3 promoter. The percentage of cytosine methylation in GBA3 promoter is 5.93 in control and 4.89 in PD respectively; they are not significantly different (p = 0.39). F. PGC-1α gene expression was determined by real time PCR. G. Image of representative western blot for PGC−1α protein expression in control and PD nigral samples. H. Quantitative densitometry of the western blotting analysis. The expression of PGC−1α was normalized for actin protein expression. I. Quantitation of the mitochondria DNA (mtDNA) to nuclear DNA (nuDNA) ratio using real-time PCR. Results were presented as mean±SEM (*p<0.05). Differences between groups were determined by unpaired Student’s t test.

