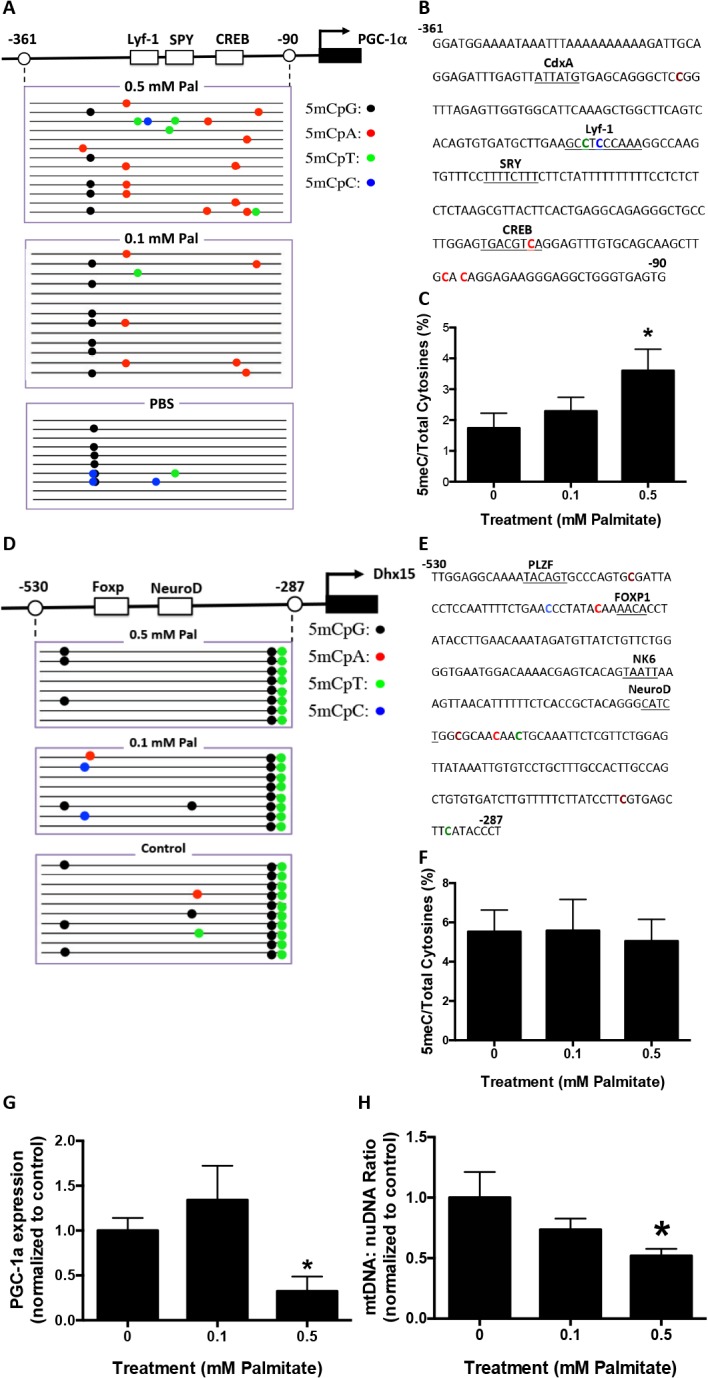
Fig 3. Palmitate induces PGC−1α promoter methylation in primary cortical neuronal cultures.

Primary mouse cortical neurons were treated with 0.1 or 0.5 mM Palmitate (Pal) for 48 hours. Genomic DNA and mRNA were isolated for bisulfite sequencing and RT-PCR analysis, respectively. Visualization of the bisulfite sequencing results for the PGC−1α and DHX15 promoters were completed using MethTools 3.0. A. Graphical depiction of the PGC−1α promoter region (-361 to -90) and location of methylated cytosines. B. Methylation sequencing region in the PGC−1α promoter. Important transcription factors are underlined. Methylated are CpG highlighted in brown, CpA in red, CpT in green and CpC in blue. C. Quantitation of cytosine methylation levels of the PGC−1α promoter. Increased methylation (106.9%) of PGC−1α promoter was observed in 0.5 mM palmitate-treated primary cortical neurons compared to PBS control (p = 0.02). D. Graphical depiction of the DHX15 promoter region (-530 to -287) and location of methylated cytosines. E. Methylation sequencing region in the DHX15 promoter. Important transcription factors are underlined. Methylated CpGs are highlighted in brown, CpAs in red, CpTs in green and CpCs in blue. F. Quantitation of cytosine methylation levels of DHX15 promoter. G. Quantification of PGC−1α mRNA by qRT-PCR revealed a 72.0% decrease with 0.5 mM palmitate treatment compared with PBS controls (p = 0.0471). H. Quantitation of the mitochondria DNA (mtDNA) to nuclear DNA (nuDNA) ratio using real-time PCR. mtDNA:nuDNA ratio was decreased by 48.0% in 0.5 mM palmitate-treated cortical neuronal cultures compared to control (p = 0.0258). Results were presented as mean±SEM, *p<0.05. ANOVA with Student-Newman-Keuls post hoc analysis (C, F, G and H).
