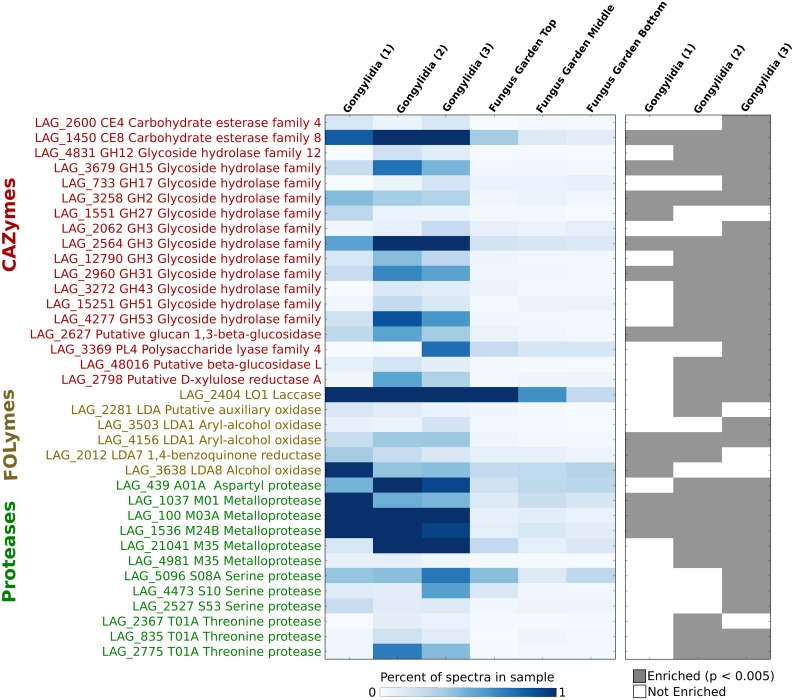
Fig 4. Heatmaps are presented that show the relative percent of total spectra that could be mapped to specific CAZymes, FOLymes, and proteases (left) and those enzymes that were found to be enriched in at least one gongylidia sample (right; Fisher’s Exact Test, p < 0.005).
Only enzymes identified as enriched in at least one gongylidia sample compared to all fungus garden samples combined are shown.

