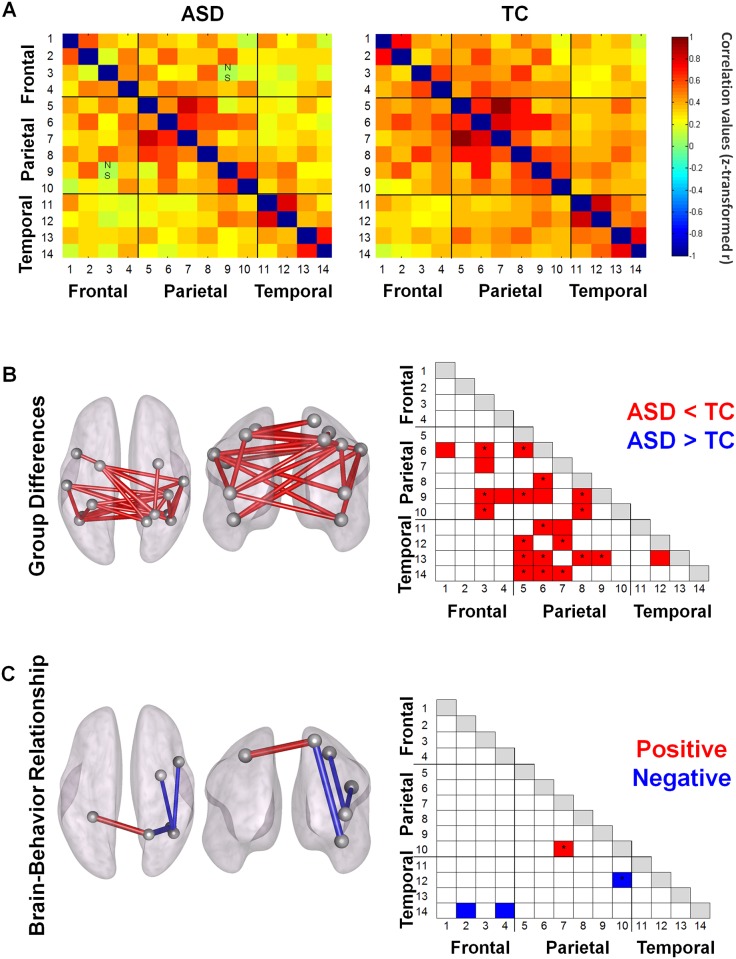
Fig 5. ROI-to-ROI intrinsic functional connectivity (iFC).
(A) ROI-to-ROI correlation matrices for the ASD- and TC-groups. Normalized correlation coefficients are shown for each of the 14 x 14 ROI correlations for each group. Each row/column is labeled with a number which corresponds to one of the 14 ROIs reported in Table 2. (B) Between-group comparisons showed significant hypo-connectivity in the ASD-group (ASD < TC). None of the connections showed hyper-connectivity in the ASD-group (ASD > TC). (C) Only a few ROI-to-ROI connections showed a significant relationship with behavioral performance on the emotion recognition task. Particularly for the right superior parietal lobule (SPL, #10), a positive (with right SPL, #7) and negative (with right fusiform gyrus, #12) relationship was shown.

