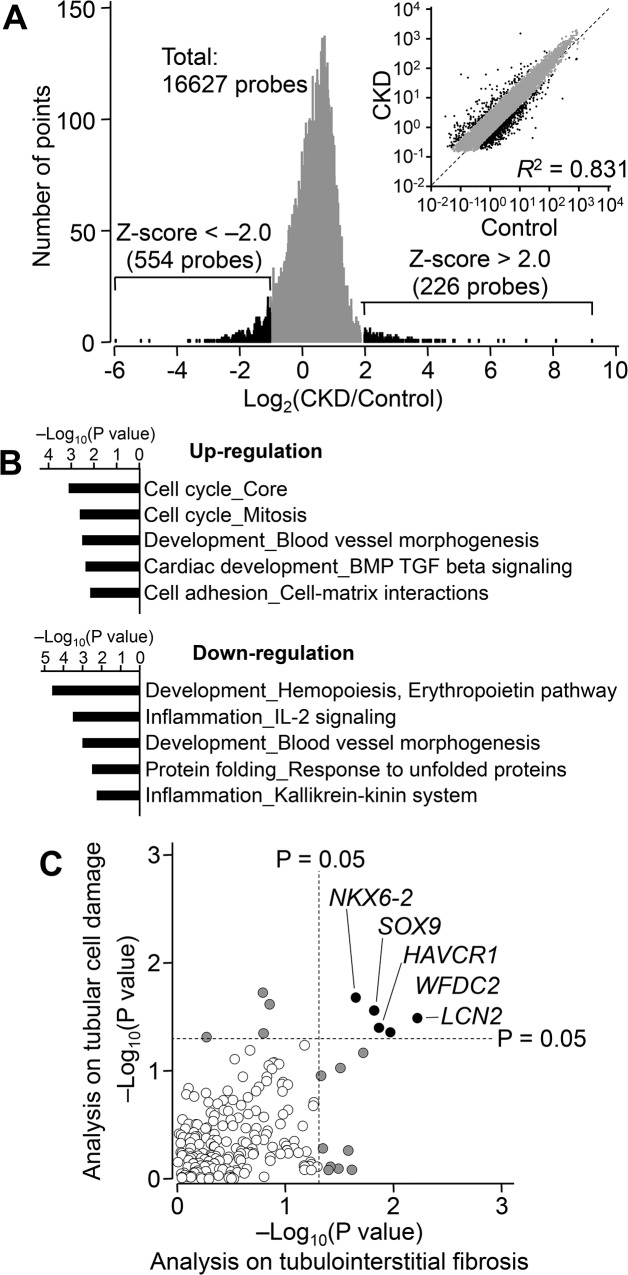
Fig 1. The Transcriptional Profile Related to Chronic Kidney Disease (CKD).
(A) Distribution of differences in gene expression between control kidney RNA (Control) and RNA extracted from 48 CKD biopsies. Microarray analysis was performed and genes down-regulated (z-score < -2.0, green) or up-regulated (z-score > 2.0, blue) in CKD are indicated. (B) Biological functions of the genes showing differential expression in CKD samples were classified according to their Gene Ontology and P values were calculated with MetaCore software. (C) Relationship between P values from Kruskal-Wallis test on tubulointerstitial fibrosis and tubular cell damage. Each symbol represents one gene. Gray or black circles indicate genes with any P values < 0.05; open circles represent genes with both P values > 0.05. HAVCR1, hepatitis A virus cellular receptor 1; LCN2, lipocalin 2; SOX9, SRY-box 9; WFDC2, WAP four-disulfide core domain 2; NKX6-2, NK6 homeobox 2.

