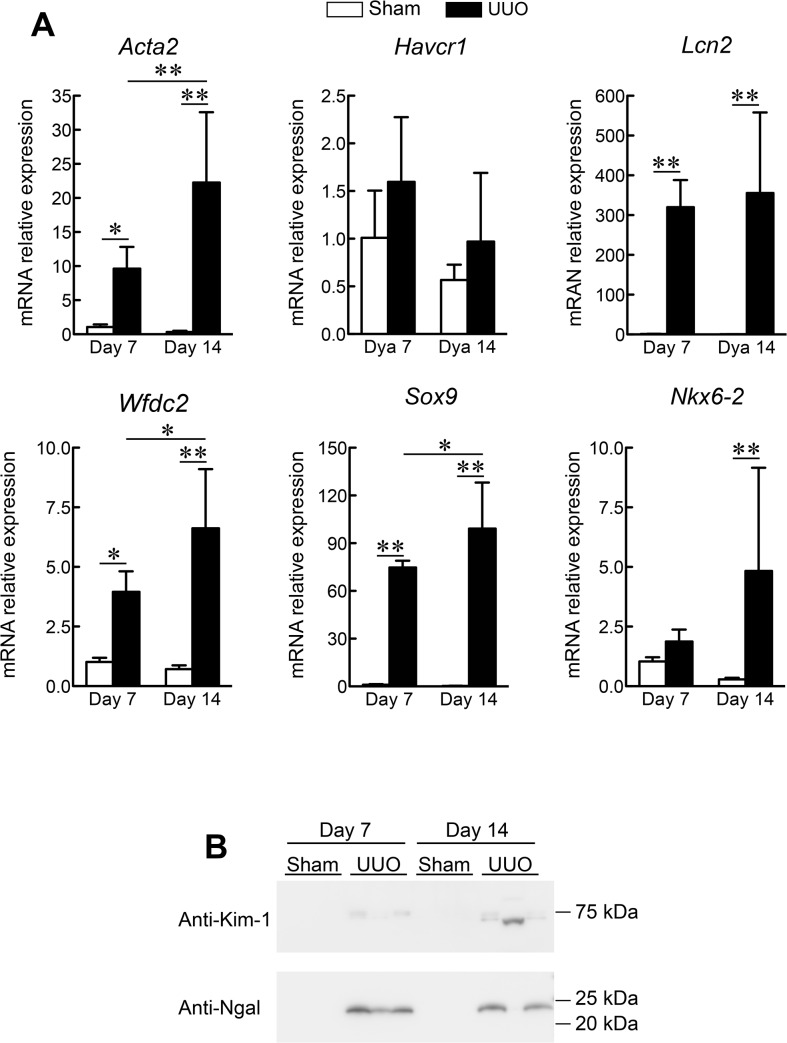
Fig 2. Mouse Kidney Gene Expression Profiles following Unilateral Ureteral Obstruction (UUO).
(A) Real-time PCR analysis was used to determine the relative mRNA levels of alpha smooth muscle actin (Acta2), hepatitis A virus cellular receptor 1 (Havcr1), lipocalin 2 (Lcn2), SRY-box 9 (Sox9), WAP four-disulfide core domain 2 (Wfdc2), and NK6 homeobox 2 (Nkx6-2) at the indicated time-points. Glyceraldehyde-3-phosphate dehydrogenase (GAPDH) mRNA was used as an internal control. Data are expressed as the mean ± standard deviation of 4–6 mice. *P < 0.05; **P < 0.01; one-way analysis of variance. (B) Western blot analysis was used to determine the leakage of Ngal (Lcn2) and Kim-1 (Havcr1) in mouse urine.

