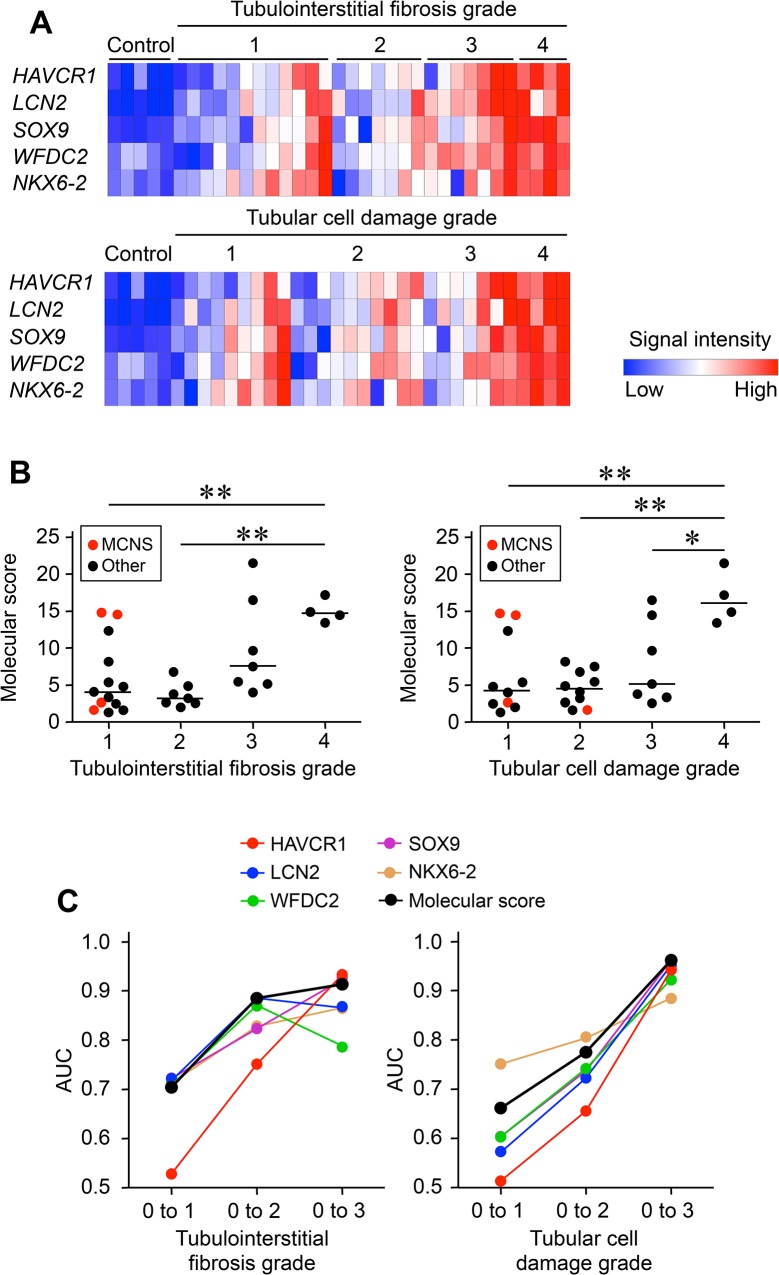
Fig 3. Analysis of the Molecular Score Performance.
(A) Relative signal intensity heatmaps for hepatitis A virus cellular receptor 1 (HAVCR1), lipocalin 2 (LCN2), SRY-box 9 (SOX9), WAP four-disulfide core domain 2 (WFDC2), and NK6 homeobox 2 (NKX6-2) in relation to renal histopathology. (B) The distribution of molecular score based on histological grades. (C) The area under the receiver operating characteristics curve (AUC) for the molecular score of each biopsy, plotted against the grade of tubulointerstitial fibrosis and tubular cell damage.

