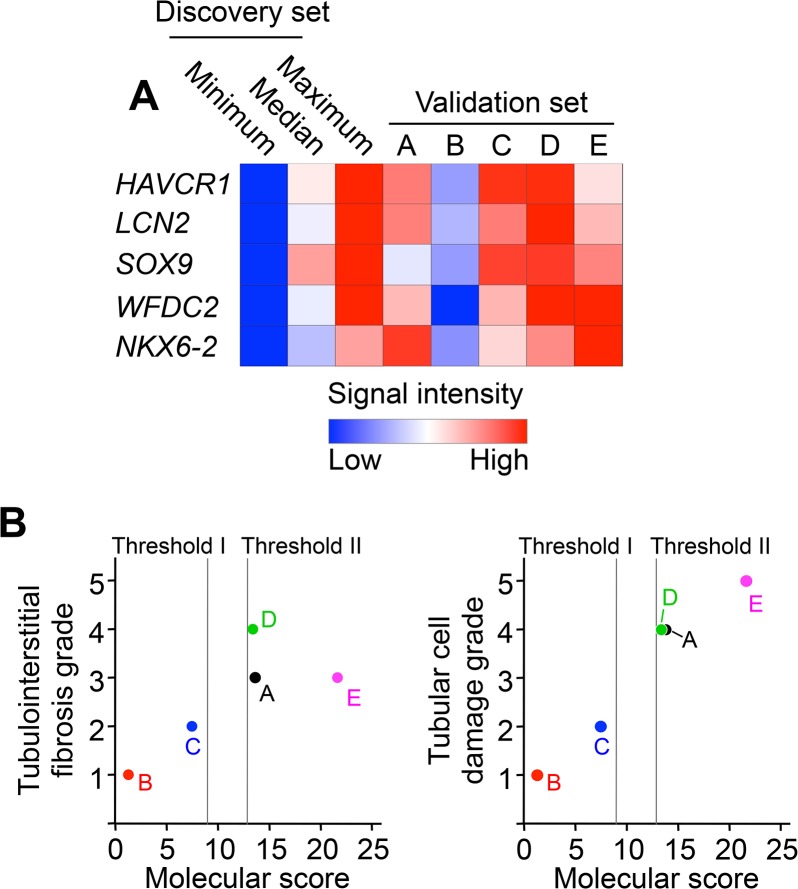
Fig 4. Validation Set Study.
Microarray analysis was performed on 5 biopsies from CKD patients in the validation set. (A) Heatmap of the relative signal intensities of hepatitis A virus cellular receptor 1 (HAVCR1), lipocalin 2 (LCN2), SRY-box 9 (SOX9), WAP four-disulfide core domain 2 (WFDC2), and NK6 homeobox 2 (NKX6-2). (B) Comparison of the molecular score with the grade of tubulointerstitial fibrosis and tubular cell damage. Dotted lines represent the threshold values corresponding to histopathology grade 3 (Threshold I) or grade 4 (Threshold II).

