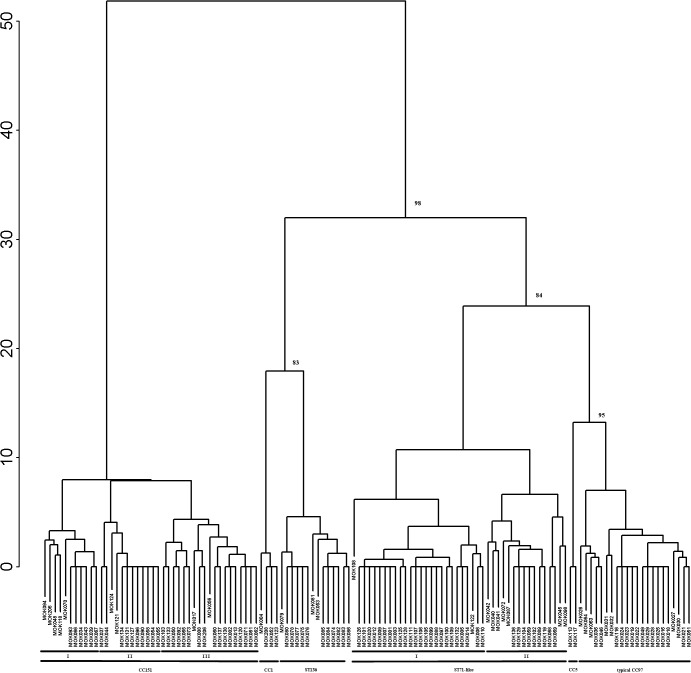
Fig 2. Relationship among the S. aureus isolates.
Hierarchical cluster dendrogram of all isolates based on their hybridization profile from the genotyping array. Bootstrap support values indicated for the major internal branches that separate the clonal complexes. Subgroups within the ST71-like group and CC151 are noted.

