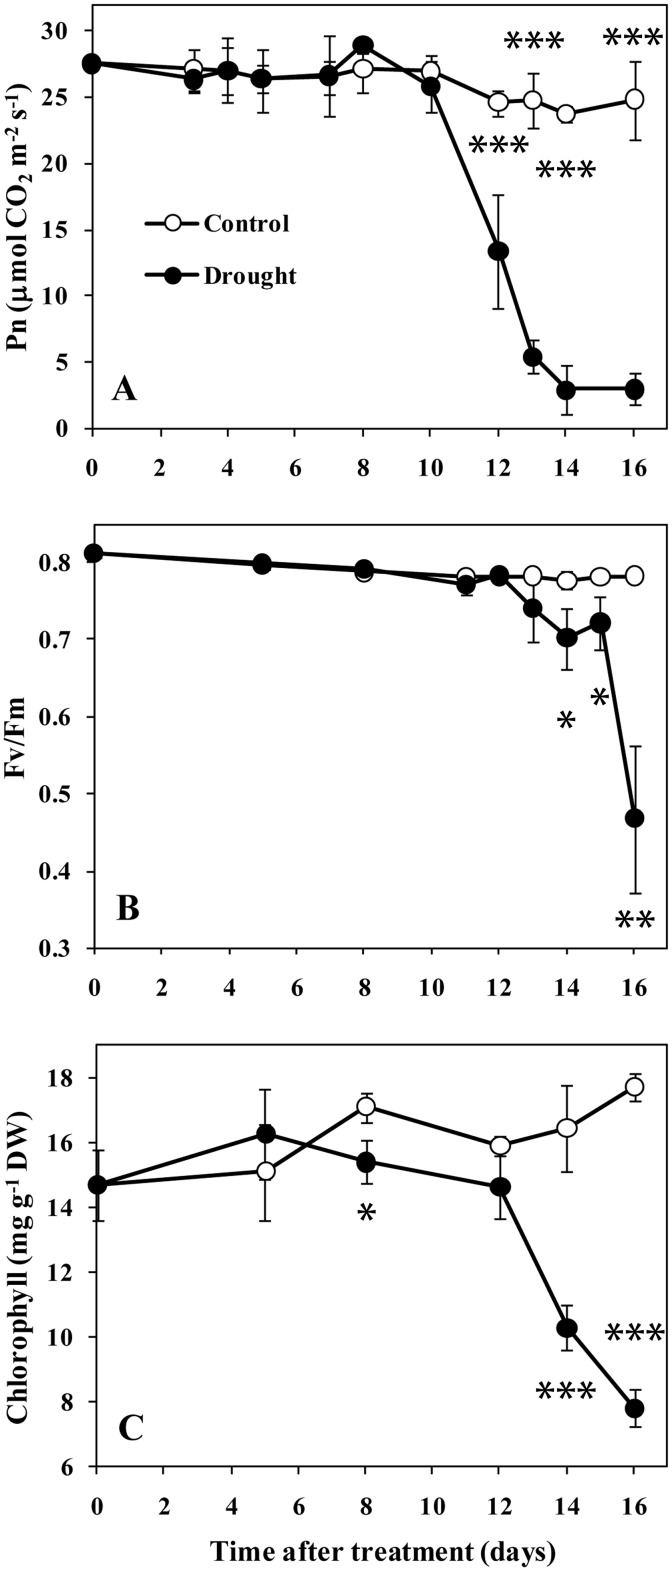
Fig 3. Senescence-dependent changes in sorghum leaf 8 during drought progression.
A, Photosynthesis. B, Maximum efficiency of PSII photochemistry (Fv/Fm). C, Chlorophyll content. Data represent the mean ± SD (n = 5). Asterisks indicate statistically significant differences between treatments (* P≤0.05; ** P≤0.01; *** P≤0.001).

