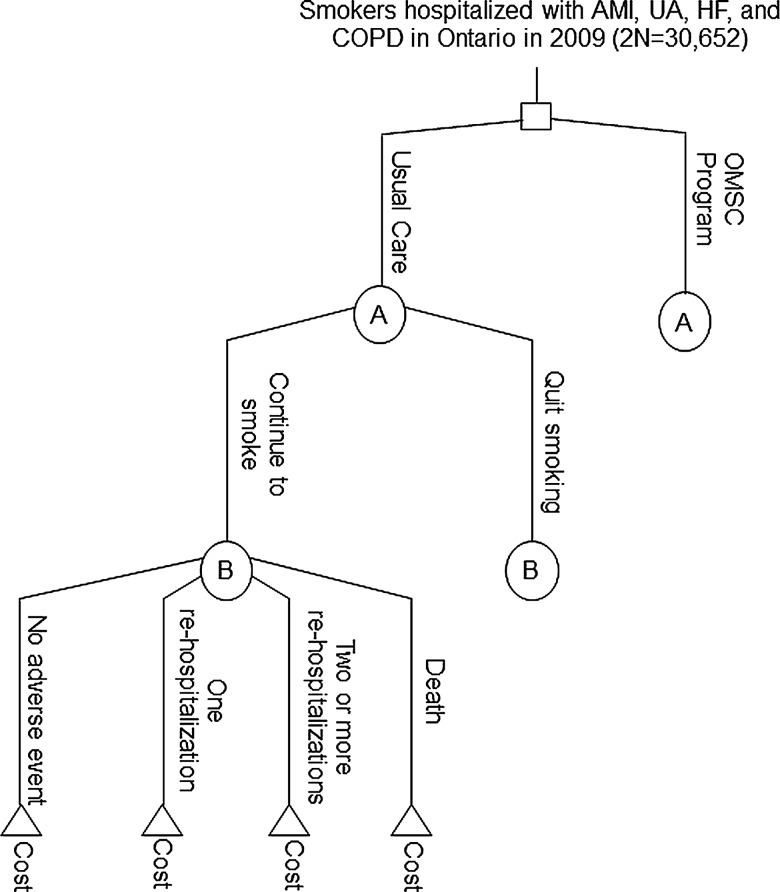
Figure 1.
Decision analytic model. The square represents a decision node. In this case we are evaluating the difference between hospitalised smokers with AMI, UA, HF, or COPD receiving either usual care or the OMSC programme. Circles A and B are chance nodes and indicate where probabilities of two or more events occur (the events are identical for each group but are only displayed for usual care). The triangles indicate terminal nodes and are the end points we wish to evaluate. AMI, acute myocardial infarction; COPD, chronic obstructive pulmonary diseases; HF, heart failure; OMSC, Ottawa model for smoking cessation; UA, unstable angina pectoris.

