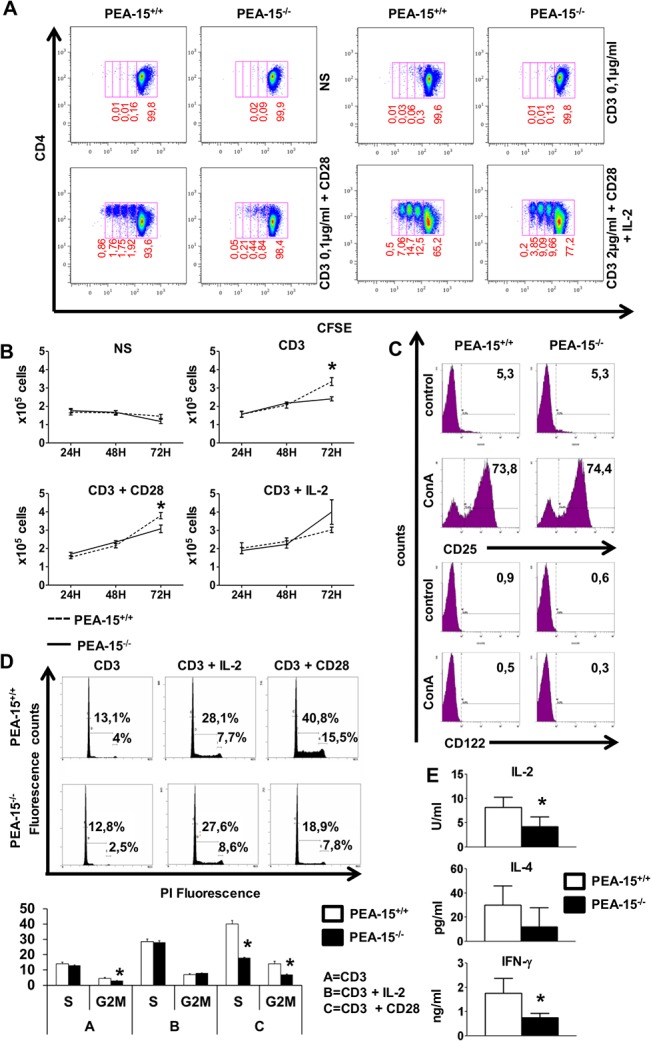
Fig 1. Activated PEA-15-/- T cells have impaired proliferation, and reduced IL-2 & IFNγ production.

(A & B) Purified lymph node (LN) CD4+ T cells of PEA-15 -/—and PEA-15 +/+ mice were stimulated with 0.1μg/ml or 2μg/ml (when indicated) of anti-CD3, with or without anti-CD28 (2μg/ml), in the presence or not of recombinant IL-2 (50U/mL). Proliferation was analyzed (A) by flow cytometry analysis of CFSE-labeled cells (numbers indicate the percentage of cells in each division at 72H, data are representative of 4 independent experiments) and (B) by enumeration of cells at the indicated time by trypan blue exclusion test. Data shown are means +/- SEM of 3 independent experiments (* p< 0.05). (C) PEA-15 -/—and PEA-15 +/+ T cells treated without (control) or with ConA mitogen for 18H, were analysed for CD25 and CD122 expression by flow cytometry at 12H and 24H after stimulation, respectively. The data shown were obtained using PE-labeled mAbs specific for CD25 and CD122 and FITC-labeled mAbs specific for CD4, and are gated on CD4-FITC positive cells. The percentage of cells in each quadrant is indicated. These values are representative of 6 experiments. (D) LN T cells from PEA-15 -/- mice and PEA-15 +/+ littermates were treated as in (A & B) for 72H. Flow cytometry of cells stained with propidium iodide (PI) gated on CD4+ cells was performed for cell cycle analysis. Histograms of the percentage of cells in the S and G2/M phases of the cell cycle of a representative experiment (D/upper panel) and cumulative data of 4 independents experiments +/-SD (* p< 0.05) (D/lower panel) are shown. (E) Purified T cells from PEA-15 -/- mice and PEA-15 +/+ littermates were stimulated as in (C). IL2 production in the culture supernatant was quantified by CTLL2 bioassay (n = 8; 3 independent experiments). Quantification of IL-4(Th2) and IFNγ (Th1) (n = 6; 3 independent experiments) in the culture supernatant was determined by ELISA (*p<0.05).
