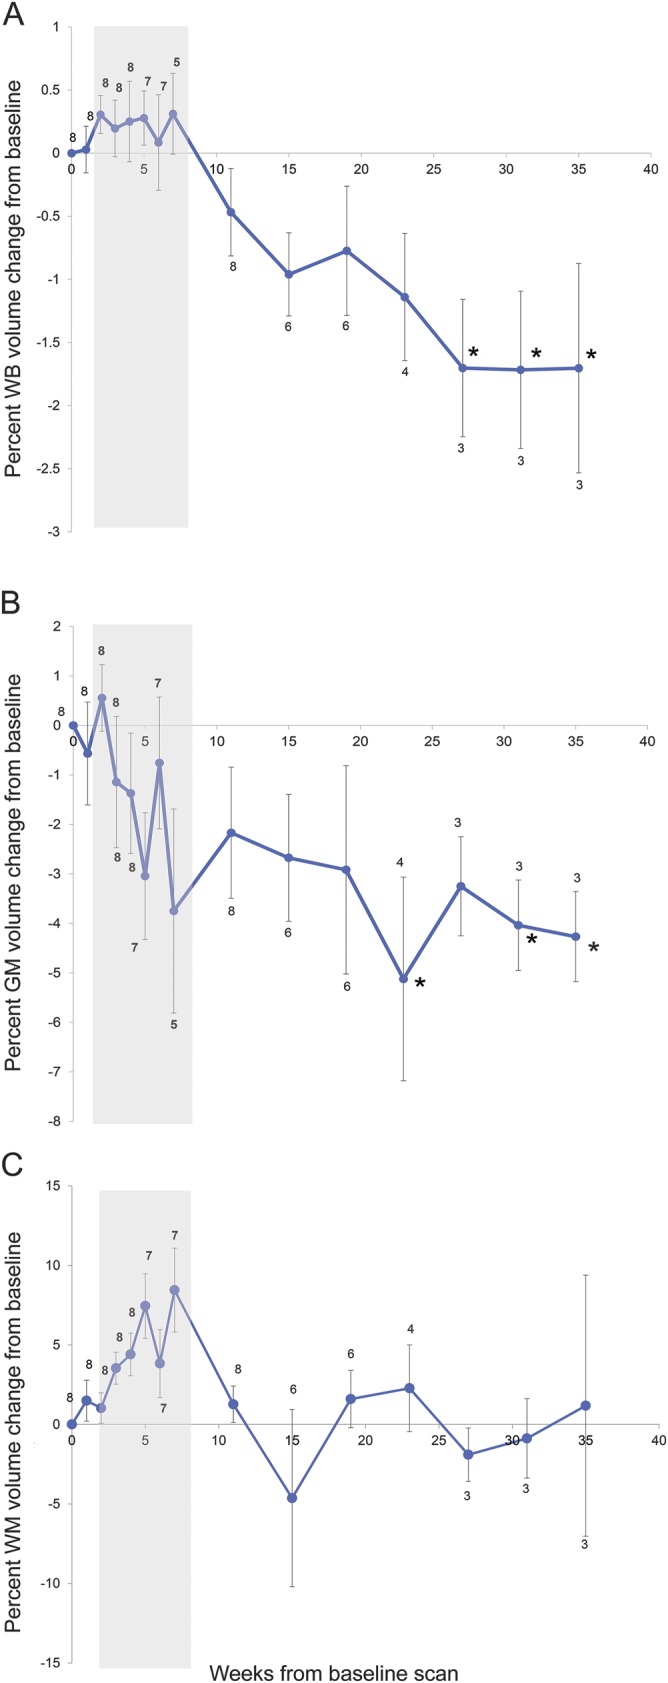
Figure 2. Longitudinal progression of WB (A), GM (B), and WM (C) volumes across the treatment period.

Data points represent the sample mean of percent volume change from baseline at each time point. Error bars represent the SEM. Sample sizes are indicated at each time point. Gray shading indicates combined chemotherapy and radiation. Six participants did not meet criteria for volumetric analysis. *Time points at which volumetric changes are statistically significant (p < 0.05). GM = gray matter; WB = whole brain; WM = white matter.
