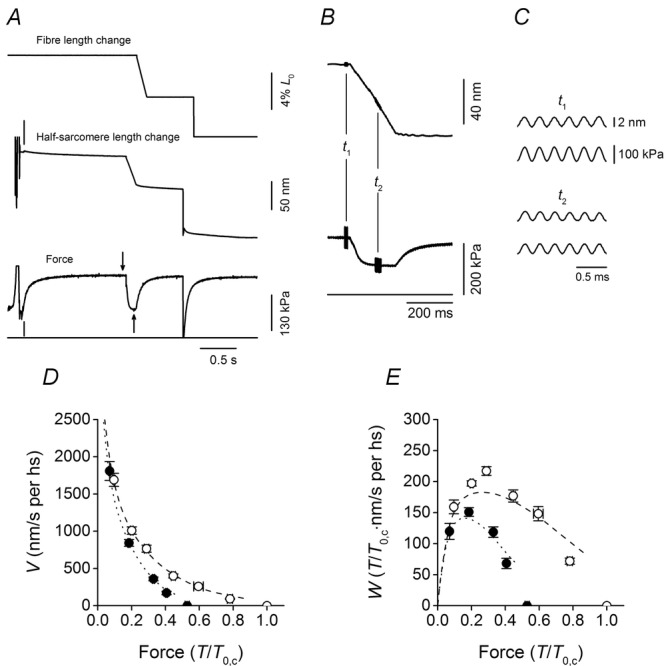
Figure 2.

Experimental protocol, force–velocity and power–velocity relations
A, records of the force and sarcomere length change in response to a ramp shortening (amplitude 5% L0, velocity 0.34 μm s−1) imposed at 1.4 s after the fibre entered the test temperature solution. Following the force recovery at the end of the ramp, a stepwise shortening of 5% L0 was imposed to drop the force to zero and have the baseline force in the test temperature solution. Upper trace, motor position; middle trace, half-sarcomere length change; lower trace, force; horizontal line, zero force. The vertical line on the half-sarcomere length trace marks the start of the striation follower recording. The vertical line on the force trace marks the time at which the fibre enters into the test temperature activating solution. The arrows mark the time of stiffness measurement at the isometric plateau (t1, downward arrow) and during shortening (t2, upward arrow). B, half-sarcomere length change (upper trace) and force (lower trace) on expanded time scales. Horizontal line, force baseline. Length oscillations of 4 kHz were imposed either at the isometric plateau (t1) or during shortening (t2). C, traces expanded further of half-sarcomere length change (upper) and force (lower) at t1 (upper panel) and t2 (lower panel). Fibre segment length, 5.4 mm; segment length under the striation follower, 1.1 mm; average sarcomere length, 2.47 μm; cross-sectional area, 6280 μm2; temperature, 11.8°C. D, force–velocity (T–V) relations in control (open circles) and in 10 mm Pi (filled circles). Force (T) is relative to the isometric plateau force in control (T0,c). E, power–force (W–T) relations obtained from T–V relations in D. Data are means ± SEM. Lines in D and E are the relations simulated with the model in Fig. 1: dashed line, control; dotted line, 10 mm Pi.
