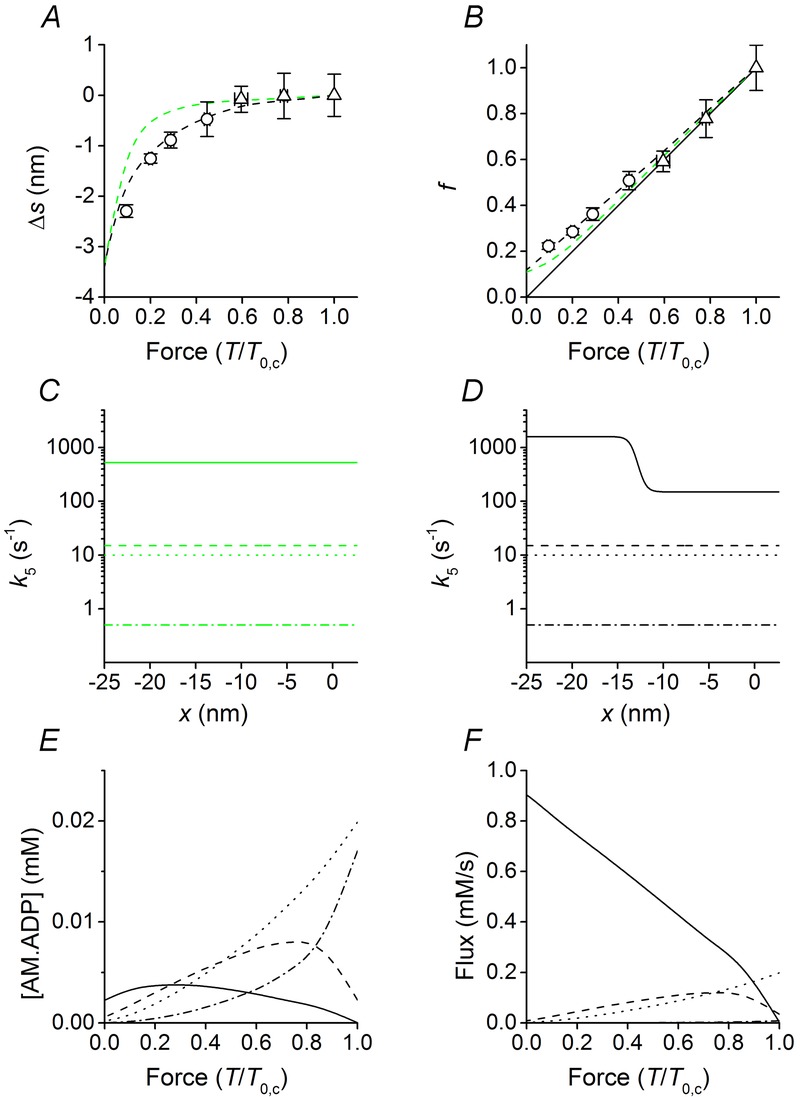
Figure 5.

Model predictions in relation to the strain dependence and load dependence of ADP release
A–B, dependence on force of Δs and f in control. Δs is the difference between s during shortening and the isometric s; f is the fraction of attached motors relative to the isometric control value. Symbols, data from Fig. 4B and C, respectively. Dashed lines, model predictions; different colours indicate different assumptions on the forward rate constants for ADP release (k5) from the four (M1–M4) structural states of AM.ADP: green, only conformation dependence for all structural states; black, the M4 state is also strain dependent. Continuous line in B is the direct proportionality line. C–D, x-dependence of k5 for M1–M4 states, identified by the line style: M1, dot-dashed line; M2, dotted line; M3, dashed line and M4, continuous line. E, load dependence of the concentrations of the four structural states of AM.ADP motors, identified by the same line code as in D. The total concentration of myosin motors is assumed to be 0.15 mm (He et al. 1997; Tikunov et al. 2001). F, load dependence of the flux through the four structural states of AM.ADP motors, identified by the same line code as in D.
