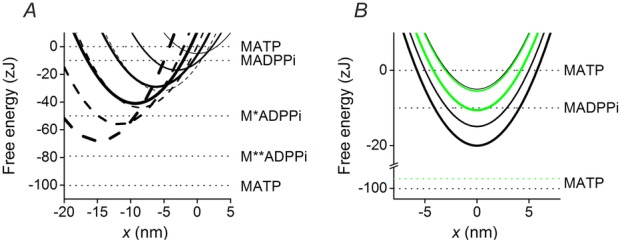
Figure 8.

Free energy diagrams of the structural and biochemical states
A, free energy diagrams of the four structural states of the myosin motor in the AM.ADP.Pi state, attached to the actin monomer either, A (continuous lines) or A′ (dashed lines). The thickness of the line identifies the progression of the state transitions, from M1, thinnest line, to M4, thickest line. x is zero in correspondence of the free energy minimum of a myosin motor attached to A in the M1 state. Horizontal lines show the free energy of the detached states. B, free energy diagrams of the myosin motor attached to the actin monomer A in the different biochemical states (AM.ADP.Pi, thinnest line; AM.ADP, medium thickness line; and AM, thickest line). Of the four structural states only M1 is shown for clarity. The black lines are in control solution (no added Pi) and the horizontal lines show the free energy of the detached states. The green lines show the effect of the addition of 10 mm Pi on the free energy level of the AM.ADP, AM and M.ATP states (the upward shift accounting for the reduction in ΔG).
