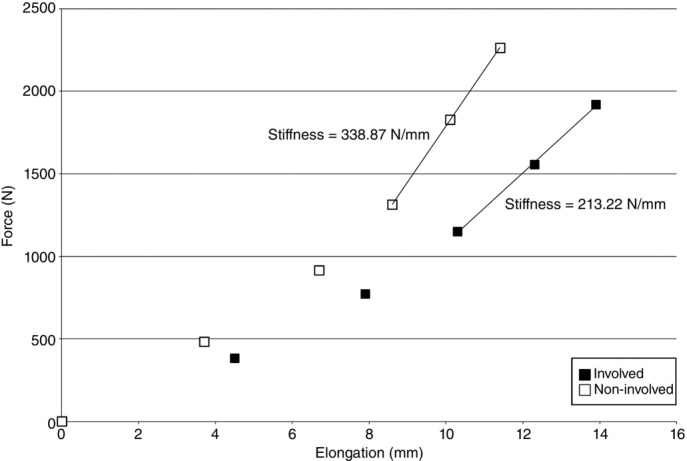
Figure 4.

Representative force–elongation plot
Plot from a single tendinotic subject’s involved (■) and non-involved (□) sides. The data are plotted at 0%, 20%, 40%, 60%, 80% and 100% of maximal Achilles tendon force for each side. The continuous line in each dataset is where the stiffness (slope) is calculated (60–100% of maximal Achilles tendon force).
