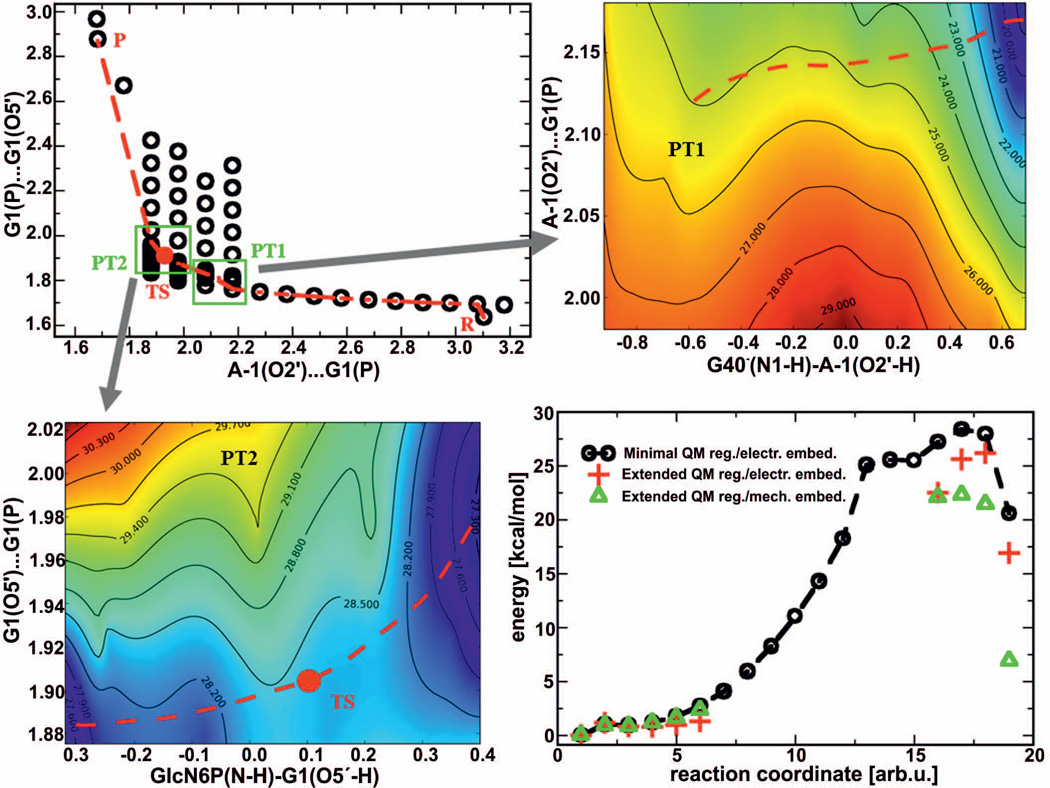
Figure 2.
Reaction pathway and the corresponding energetics (bottom right diagram) of the glmS ribozyme self-cleavage mechanism induced by the presence of the ammonium form of GlcN6P and activated by a deprotonated guanine G40−. The circles in the top left graph represent the sampling points on the potential energy surface along the path of nucleophilic attack, while the red line corresponds to the minimal energy path. The zoomed-in regions shown in the top right and bottom left plots correspond to proton transfers from the A-1(2’-OH) nucleophile to the deprotonated G40− (PT1) and from the ammonium group of GlcN6P to the G1(O5’) leaving group (PT2), respectively. The contours in these graphs represent the uncorrected energies calculated with a minimal QM region with electronic embedding labeled in kcal/mol.

