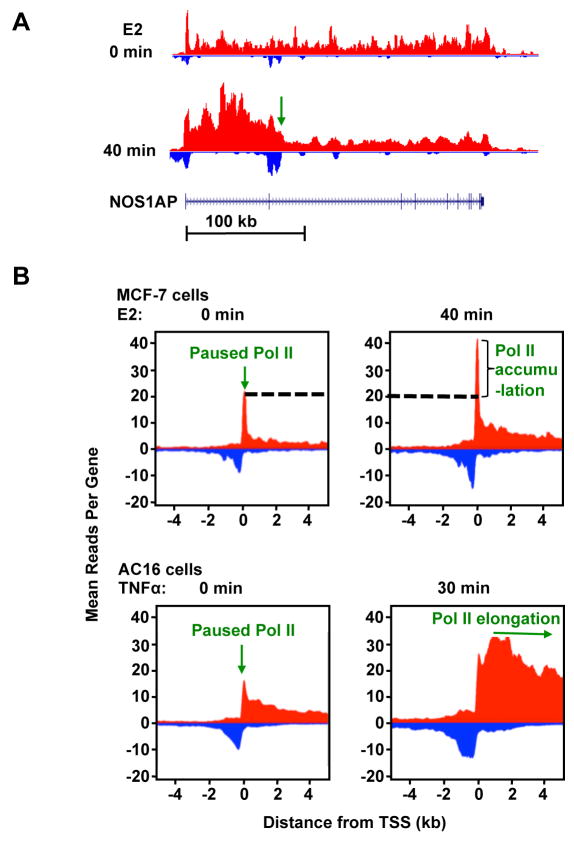
Figure 2. GRO-Seq reveals the dynamics of Pol II elongation upon stimulation by signaling pathways.
(A) Genome browser views of GRO-seq data showing the Pol II elongation pattern of an estradiol (E2)-stimulated gene in MCF-7 human breast cancer cells. The green arrow indicates the leading edge of elongating Pol II after 40 min of treatment with E2. The elongation rate of Pol II can be calculated as: , for example. GRO-seq signals from positive and negative strand are represented by red and blue color, respectively.
(B) Metagene representations showing the average profile of GRO-seq reads ± 4 kb around the transcription start sites (TSS) of activated genes in E2-treated MCF-7 cells (top) and TNFα-treated AC16 cells (bottom). In MCF-7 cells, 40 min of treatment with E2 induces a more dramatic increase of Pol II density near the TSS compared to that in the gene body, suggesting that newly recruited Pol II is paused before entering productive elongation. By contrast, in AC16 cells, 30 min of treatment with TNFα results in a rapid increase and release of Pol II into the gene body, suggesting that TNFα signaling mainly regulates the pause release step of Pol II elongation. Adapted from [15,16].

