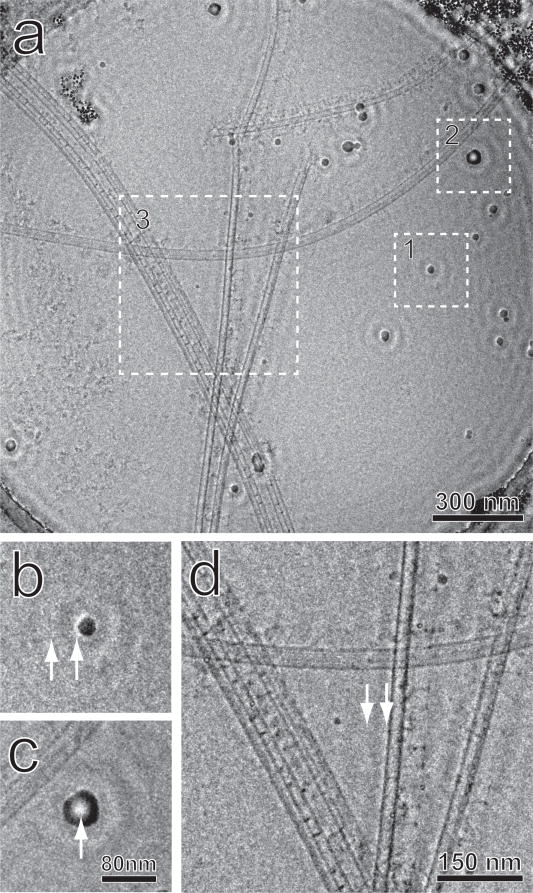
Fig. 1.
A zero-tilt micrograph from the tomographic series. (a) The entire field, (b) Region 1, a small contaminating ice particle used as a test object. (c) Region 2, a larger ice particle. (d) Region 3, a magnified view of the central area. Arrows in (b) and (d) indicate the halos and fringes caused by the cut-on of the Zernike phase plate. The arrow in (c) shows inverted contrast at the center of the particle.

