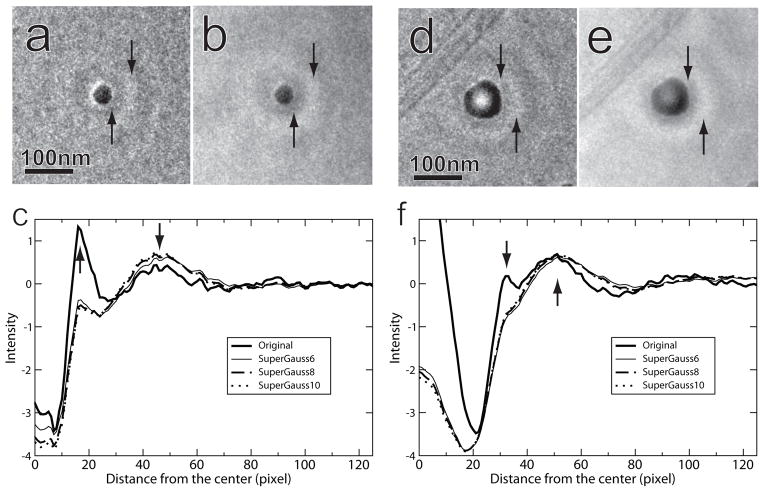
Fig. 4.
Results of de-fringing for objects of various sizes. The small (a) and large (d) particles were taken from Figs. 1b and 1c, respectively. (b) and (e) show the particles after de-fringing. The arrows in these images indicate the halo and the first bright fringe-ring. (c) and (f) display rotationally averaged intensity profiles, radially from the particle centers, demonstrating the effect of three different filter powers, compared to unfiltered images.

