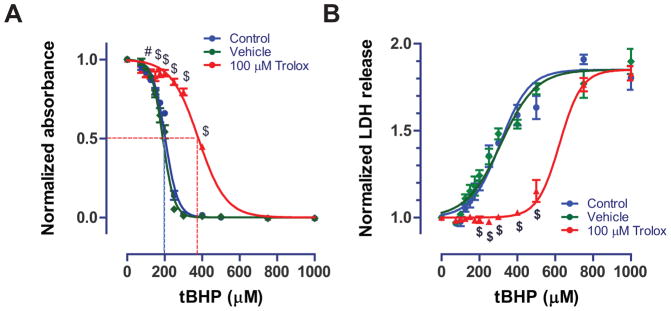
Figure 3.

A. Dose-response curve for tBHP using the MTT assay. Trolox shifted the half-maximal effect (IC50) for tBHP rightward by approximately 180 μM. IC50 values obtained from the MTT assay were 194 μM, 191 μM, and 383 μM for control, vehicle (0.1% ethanol), and Trolox (100 μM), respectively. Dotted lines represent the IC50 value. Cells from passage 7 were used. B. Similar results were obtained when quantifying LDH release using our novel custom assay. The custom assay yielded reliable quantification of cellular LDH release, which increased in response to tBHP 1.85-fold. Trolox (100 μM) significantly shifted the half-maximal (EC50) values for tBHP (276, 281, and 550 μM for control, vehicle, and Trolox conditions). Cells from passage 7 were used. Data is shown as mean ± s.e.m. from five separate plates (n=5) and analyzed using ANOVA (P < 0.001). # P < 0.01, $ P < 0.001 based on a Bonferroni post-hoc test compared to the control condition (0 μM tBHP).
