Figure 1.
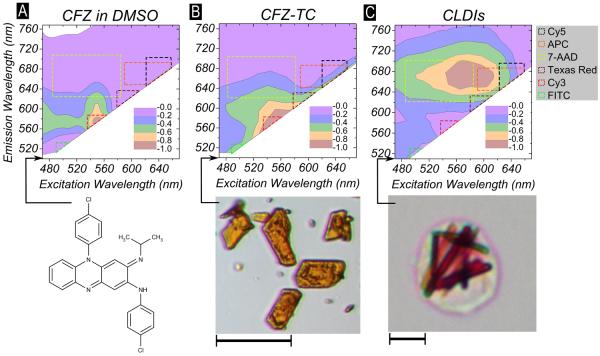
Fluorimetric analysis of (A) CFZ dissolved in DMSO (20 μM) done using conventional solution fluorimetry (bottom – chemical formula of CFZ) and (B) CFZ-TC (bottom – representative picture, scale bar = 10 μm) and (C) isolated CLDIs from spleen (bottom – representative picture, scale bar = 10 μm) acquired using spectral confocal microscopy. The excitation wavelength (nm, Ex) and emission wavelength (nm, Em) are shown on the X-axis and Y-axis, respectively. The normalized fluorescence yield is shown by a contour plot that was normalized to the maximum measured fluorescence yield. Both solubilized CFZ in DMSO and CFZ-TC had peak fluorescence yield at Ex:540-570 nm, Em: 560–580 nm while CLDIs had peak fluorescence yield at Ex:560-600 nm, Em: 640–700 nm. The excitation/emission combination for detection of commonly used fluorophores: FITC, Cy3, Texas Red, 7-AAD, APC and Cy5 are also shown as dotted bounded shapes super-imposed on the contour plots.

