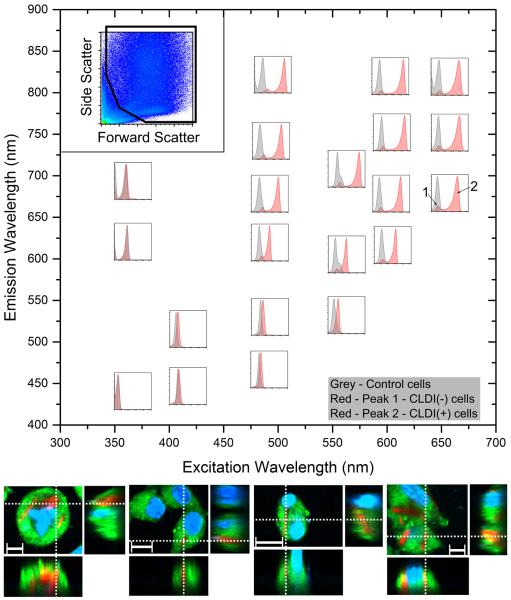
Figure 2.
Flow cytometric analysis of RAW264.7 incubated with CLDIs using a variety of laser combinations on a MoFlo Astrios. (top left inset) The forward scatter versus the side scatter used for further analysis. Various sub-plots are arranged based on excitation and emission wavelength combination in the main graph (X-axis = excitation wavelength, Y-axis = emission wavelength). A single population is observed with RAW264.7 cells alone (shown in grey histogram in each sub-plot). A single population is observed with RAW264.7 cells with CLDIs when excited with UV laser (excitation=355 nm, all emission detector settings), violet laser (excitation=405 nm, all emission detector settings), blue laser (excitation=488 nm, emission=513 nm, 576 nm) and orange laser (excitation=561 nm, emission=579 nm). In all other laser combinations, two populations were observed (labeled 1 and 2). (bottom) Confocal microscopy of RAW264.7 incubated with CLDIs confirmed the phagocytosis of CLDIs using the fluorescence of CLDIs in the Cy5 channel while cells were stained with membrane stain FM 1–43 (green) and nuclear counterstain Hoechst 33342 (blue) (Scale bar = 10 μm, dotted lines show the visualization planes for the three orthogonal views).

