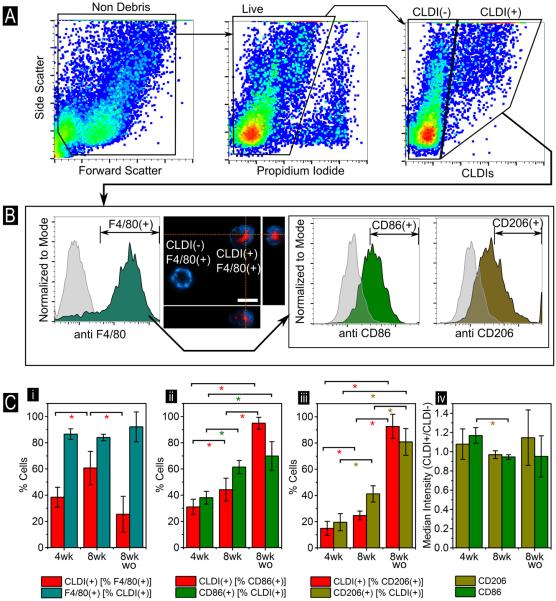
Figure 5.
(A) Flow cytometry analysis of peritoneal exudate in CFZ mice (Schematic for quantification shown in Figure S1). Gating was done via viability using PI (compensated 561 614/10 settings) and then for CLDI-associated signal at 640 795/70. (B) The peritoneal exudate was also dual labeled with antibodies for the pan-macrophage marker F4/80 (detected using 405 448/59) followed by either CD86 or CD206 (488 513/26). Gating for CLDI(+) followed by F4/80(+) and CD86(+) or CD206(+) is shown. CLDI+ cells were significantly F4/80+ with a medium expression of CD86 and CD206. Gating for antibody positivity was done via the corresponding isotype (grey background histogram). Confocal microscopy shows the membrane staining of the F4/80 surface marker in blue while CLDIs are shown in red (Scale bar = 10 μm, dotted lines show the visualization planes for the three orthogonal views). (C) Cumulative statistics on CLDI(+) cells that are (i) F4/80+, (ii) CD86+ and (iii) CD206+ in CFZ mice at four weeks (4wk), eight weeks (8wk) and eight weeks + eight weeks washout (8wk wo) post drug feeding. Error bars show standard deviation (n=4 mice). (iv) Median expression of CD86 and CD206 in CLDI+ F4/80+ relative to CLDI- F4/80+ were also compared at all time points. * indicates p<0.05 (Student's t-test).

