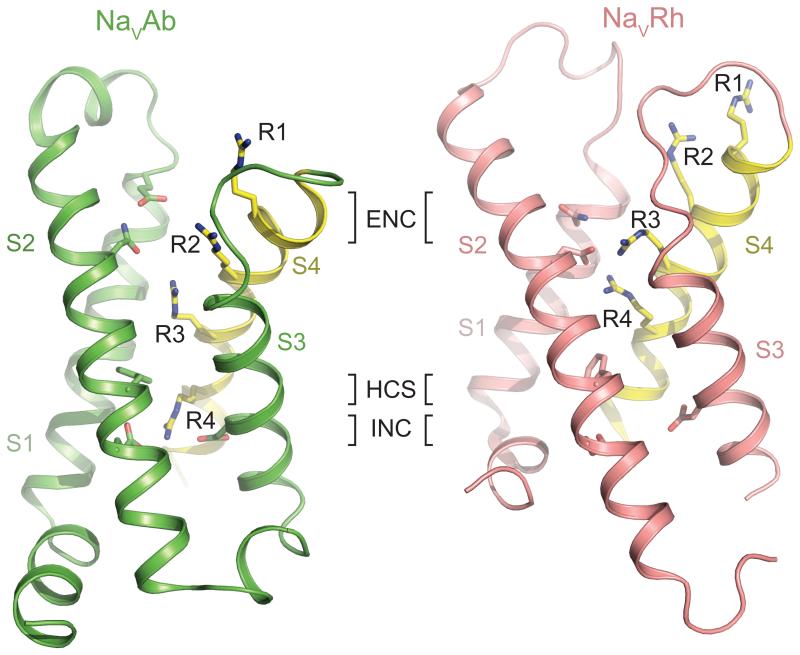
Figure 3. A Comparison of the Voltage-sensor Domains of NaVAb and NaVRh.
The VSMs of NaVAb (left, green) and NaVRh (right, salmon) are shown in ribbon diagram [9, 11]. The sliding S4 helix is highlighted in yellow with the side chains of the four gating charge arginine residues (R1-R4) shown in sticks. Key residues forming the extracellular negative cluster (ENC), intracellular negative cluster (INC), and hydrophobic constriction site (HCS) are shown in sticks. The R4 residue of NaVAb and NaVRh interacts with the INC and ENC residues, respectively.

