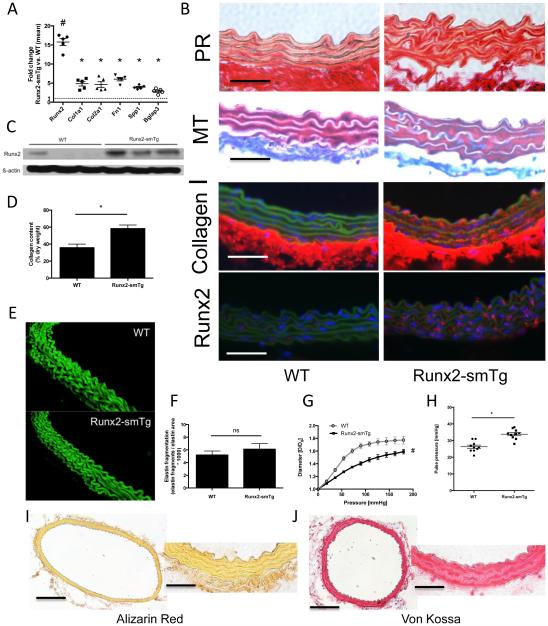
Figure 3. VSMC-specific Runx2-overexpression (Runx2-smTg mice) induces aortic medial fibrosis, stiffness and hypertension.
(A) Expression levels of Runx2, Col1a1, Col1a2, Fn1, Spp1, and Bglap3 in thoracic aortae of 20 week-old Runx2-smTg mice compared to age-matched WT controls. Values are expressed as fold changes relative to the mean expression level in WT controls (=1; dotted line). # indicates p < 0.001 vs. WT controls, * indicates p < 0.05 vs. WT controls (n=5/group). (B) Aortic cross section from 20 week-old mice. Representative images of aortic cross section stained with Picrosirius Red (PR; collagen red, muscle yellow) and Masson’s Trichrome (MT; collagen blue, muscle red). Representative immunofluorescent images of aortic cross section stained for collagen I (red) or Runx2 (red). Green depicts the autofluorescence of the elastic lamella. Nuclei are Hoechst stained (blue). Original magnifications are 400x, scale bars 50 μm. (C) Aortic Runx2 protein expression in Runx2-smTg mice and WT controls. (D) Total collagen content per aortic dry weight. n=4/group. * indicates p < 0.05. (E) Representative images of aortic elastin lamellae (3D reconstruction of 28 individual layers). (F) Elastin fragmentation index quantified from 3 high power fields of 3 different aortas per group. (G) Aortic pressure-diameter curves from 20 weeks old mice. Values are mean ± SEM. # indicates p<0.05 vs. control for pressure levels ≥ 36 mmHg. (H) Pulse pressure derived from 20 week-old mice. * indicates p<0.05. n = 10/group (I,J) Representative images of thoracic aortic cross sections stained for calcium (Alizarin Red; I) and inorganic phosphate (von Kossa; J). Original magnifications are 100x (left panels; scale bars 200 μm) and 400x (right panels; scale bars 50 μm).

