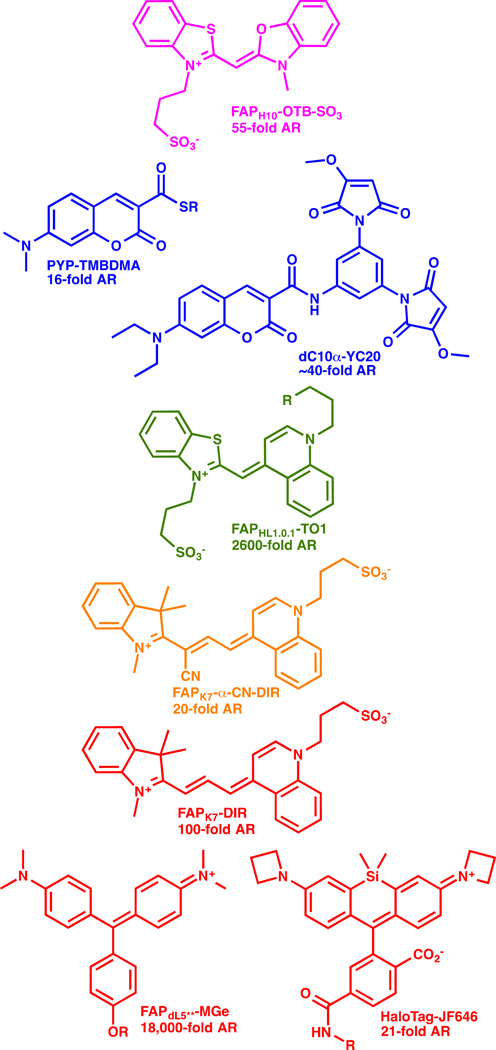
Figure 3. Fluorogen dye structures spanning the visible spectral range.
Fluorogenic dyes of various structure and spectral properties have been demonstrated for labeling of living cells. The dye structure is shown, along with the activating protein (as named in the cited references), and the reported activation ratio (AR). References: OTB-SO3 [25]; TMBDMA [28]; YC20 [21]; TO1 [12]; α-CN-DIR [27]; DIR [26]; MG [30]; JF646 [24].

