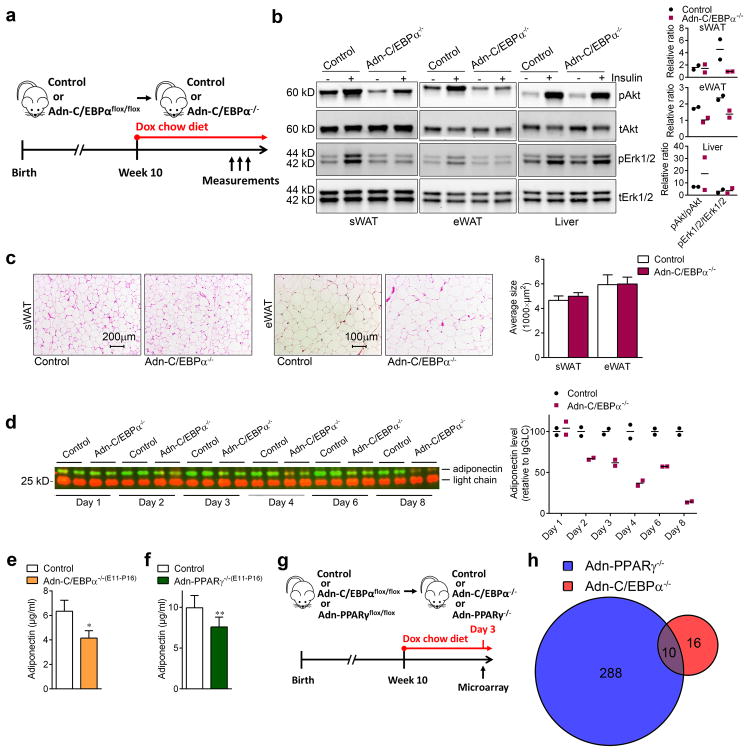
Figure 3. Normal viability and lipid accumulation in inducible C/EBPα deficient adipocytes in vivo.
a. Experimental design: Adn-C/EBPαflox/flox mice started doxycycline chow diet treatment on 10 weeks of age to generate Adn-C/EBPα−/− mice.
b. Western-blots of phospho-Akt (Ser473), total Akt, phospho-Erk1/2 (Thr202/Tyr204) and total Erk1/2 levels in protein extracts of sWAT, eWAT and liver from Adn-C/EBPα−/− mice and their control littermates after 4 days of doxycycline chow diet feeding. n = 2 male mice per group. The bar graphs indicate the fold stimulation of pAkt and pErk1/2 phosphorylation relative to tAkt and tErk1/2. Data represent the mean. These images are representative of two independent Western-blot experiments.
c. H&E staining (left) and average adipocyte size (right) in sWAT and eWAT of both groups after 1 month of doxycycline HFD feeding. These images are representative of two independent experiments. For adipocyte sizes, n = 154 cells (control, sWAT); 192 cells (Adn-C/EBPα−/−, sWAT); 76 cells (control, eWAT); 86 cells (Adn-C/EBPα−/−, eWAT). All data represent the mean ± s.e.m.. All from one image shown in the figure. This data is from a single experiment.
d. Western-blot of circulating adiponectin after 1–8 days of doxycycline chow diet feeding and quantification (left). Relative protein levels were determined by densitometry quantification of the immunoblots after normalization to IgG light chain (LgGLC) (right). n = 2 male mice per group. Data represent the mean. Theses image is representative of three independent Western-blot experiments.
e, f. Circulating adiponectin levels tested by ELISA in Adn-C/EBPα−/−(E11-P16) male mice (e), Adn-PPARγ−/−(E11-P16) male mice (f) and their control male littermates at 8 weeks of age. n = 5 male mice (control group for both e and f), n = 3 male mice (Adn-C/EBPα−/−(E11-P16) group), n = 9 male mice (Adn-PPARγ−/−(E11-P16) group). *, P = 0.01 for Adn-C/EBPα−/−(E11-P16) mice; **, P = 0.008 for Adn-PPARγ−/−(E11-P16) mice. All data represent the mean ± s.e.m. Student’s t-test.
g. Experimental design: for microarray analysis, 10 weeks old Adn-C/EBPαflox/flox male mice or Adn-PPARγflox/flox male mice and their control male littermates were kept on doxycycline chow diet for 3 days to generate Adn-C/EBPα−/− or Adn-PPARγ−/− mice. n = 14, control group for Adn-PPARγ−/−; n = 10, Adn-PPARγ−/− group and control group for Adn-C/EBPα−/−; n = 12, Adn-C/EBPα−/− group.
h. Overlap of C/EBPα direct responsive genes and PPARγ direct responsive genes. P cut-off: 0.05; fold change cut-off: 1.5. Student’s t-test. This data is from a single experiment.

