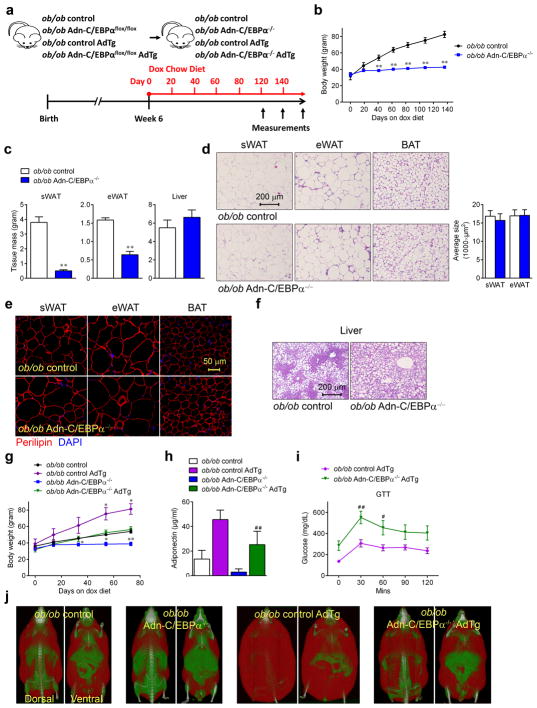
Figure 5. Inducible deletion of C/EBPα in adipocytes of ob/ob mice attenuates adipose tissue expansion, which can be rescued by adiponectin overexpression.
a. Experimental design: ob/ob Adn-C/EBPαflox/flox mice or ob/ob Adn-C/EBPαflox/flox AdTg mice started doxycycline chow diet treatment at 6 weeks of age to generate ob/ob Adn-C/EBPα−/− mice or ob/ob Adn-C/EBPα−/− AdTg mice.
b. Body weights during doxycycline chow diet feeding. n = 5 male mice per group. **, P <0.001 at day 41, 62, 83, 108 and 136. Student’s t-test. This experiment is representative of two independent experiments. c. sWAT, eWAT and liver tissue weight. n = 5 male mice per group. **, P <0.001, compared to ob/ob control group. Student’s t-test. This experiment is representative of two independent experiments.
d. H&E staining (left) of sWAT, eWAT and BAT, and average adipocyte size (right) of sWAT and eWAT, as indicated. These images are representative of two independent experiments. For adipocyte sizes, n = 105 cells (ob/ob control, sWAT); 60 cells (ob/ob Adn-C/EBPα−/−, sWAT); 80 cells (ob/ob control, eWAT); 89 cells (ob/ob Adn-C/EBPα−/−, eWAT). All data represent the mean ± s.e.m. Student’s t-test. All from one image shown in the figure. This data is from a single experiment..
e. Immunofluorescence staining for perilipin (red) and DAPI (blue) in sWAT, eWAT and BAT. These images are representative of two independent experiments.
f. H&E staining of liver. These images are representative of two independent experiments.
g. Body weights during doxycycline chow diet feeding. n = 3 male mice (ob/ob control group, ob/ob control AdTg group and ob/ob Adn-C/EBPα−/− group), n = 7 male mice (ob/ob Adn-C/EBPα−/− AdTg group). *, P = 0.03, 0.02 at day 54 and 73 for ob/ob control AdTg compared to ob/ob control group. *, P = 0.03, 0.01 at day 33 and 54; **, P <0.001 at day 73 for ob/ob Adn-C/EBPα−/− compared to ob/ob control group. Data represent the mean ± s.e.m. Student’s t-test. This experiment is representative of two independent experiments.
h. Circulating adiponectin levels tested by ELISA. n = 2 male mice (ob/ob control group), n = 8 male mice (ob/ob control AdTg group), n = 5 male mice (ob/ob Adn-C/EBPα−/− group), n = 6 male mice (ob/ob Adn-C/EBPα−/− AdTg group). ##, P <0.001 compared to ob/ob control AdTg group. Data represent the mean ± s.e.m. Student’s t-test. This data is from a single experiment.
i. GTT performed during the 10th week of doxycycline chow diet. n = 13 male mice (ob/ob control AdTg group), n = 12 male mice (ob/ob Adn-C/EBPα−/− AdTg group). *, P = 0.02, at 60 minutes; **, P = 0.001 at 30 minutes compared to ob/ob control AdTg group. Data represent the mean ± s.e.m. Two-way ANOVA. This data is from a single experiment.
j. Magnetic resonance imaging analysis at the 8th week of doxycycline chow diet feeding. These images are from a single experiment.

