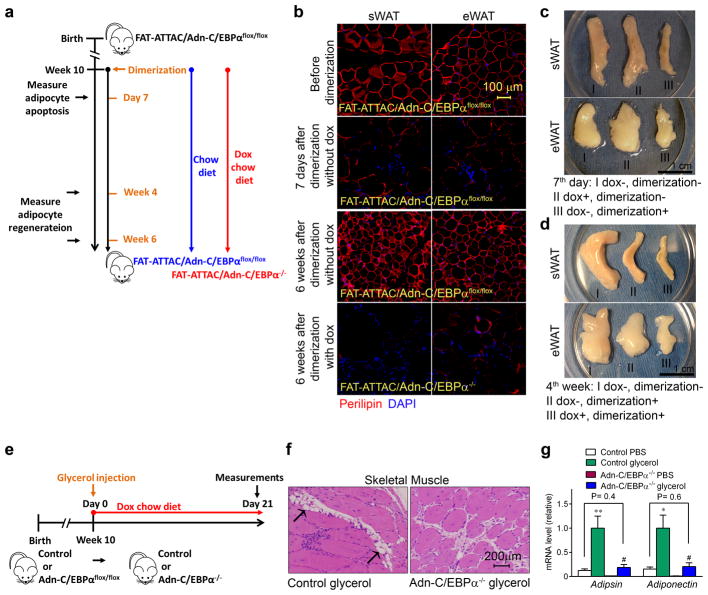
Figure 6. C/EBPα is required for terminal white adipogenesis in the adult stage.
a. Experimental design: FAT-ATTAC/Adn-C/EBPαflox/flox mice were kept on chow diet before dimerization. After dimerization at 10 weeks of age, mice were kept on chow diet (FAT-ATTAC/Adn-C/EBPαflox/flox) or switched to doxycycline chow diet (FAT-ATTAC/Adn-C/EBPα−/−) for up to 6 weeks.
b. Perilipin (red) and DAPI (blue) immunofluorescence staining in sWAT and eWAT of FAT-ATTAC/Adn-C/EBPαflox/flox mice before dimerization, 7 days after dimerization without doxycycline treatment, 6 weeks after dimerization without doxycycline treatment (FAT-ATTAC/Adn-C/EBPαflox/flox) or with doxycycline treatment (FAT-ATTAC/Adn-C/EBPα−/−). These images are representative of two independent experiments.
c. Whole tissue pictures of sWAT and eWAT of FAT-ATTAC/Adn-C/EBPαflox/flox mice 7 days post dimerization (without doxycycline treatment) (III), compared to FAT-ATTAC/Adn-C/EBPαflox/flox littermate without dimerization and doxycycline treatment (I), or FAT-ATTAC/Adn-C/EBPα−/− littermate with doxycycline treatment (II) but without dimerization. These images are representative of two independent experiments.
d. Whole tissue pictures of sWAT and eWAT of FAT-ATTAC/Adn-C/EBPαflox/flox mice (without dox) (II) and FAT-ATTAC/Adn-C/EBPα−/− littermate (with dox) (III) 4 weeks post dimerization, compared to FAT-ATTAC/Adn-C/EBPαflox/flox littermate without dimerization and doxycycline treatment (I). These images are representative of two independent experiments.
e–g. Experimental design: Adn-C/EBPαflox/flox male mice and their control male littermates at 10 weeks of age were injected with glycerol intramuscularly into the right side of tibialis anterior muscle to induce muscle injury, while PBS was injected to the left side of tibialis anterior muscle as vehicle control (e). 3 weeks after glycerol injection, representative H&E staining shows the tissue morphology and adipocyte (arrows) in tibialis anterior muscles These images are representative of two independent experiments. (f). qPCR analysis shows the mRNA expression levels of adipocyte markers adipsin and adiponectin in muscles injected with PBS or glycerol, both in Adn-C/EBPα−/− mice and their control littermates (g). n = 5 mice per group. Data represent the mean ± s.e.m. **, P = 0.008; *, P = 0.01 (adipsin) compared to control PBS group; #, P = 0.02; #, P = 0.04 (adiponectin) compared to Adn-C/EBPα−/− PBS group. Student’s t-test. This experiment is representative of two independent experiments.

