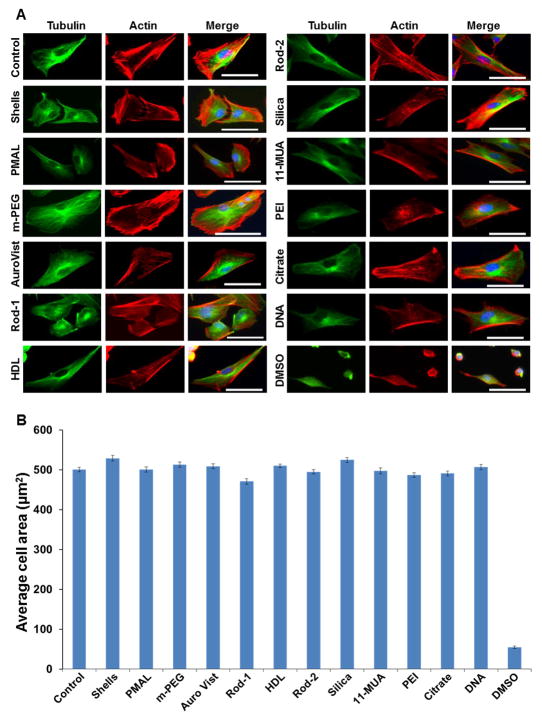
Figure 4.
Effect of AuNP on cell cytoskeleton and cell spreading. A) Representative fluorescence micrographs of BJ5ta cells stained for actin (red) and tubulin (green). The nuclei are stained with DAPI (blue). Scale bar is 25 μm. Panel B, graph showing the average cell area after 1 hour exposure of AuNP to the BJ5ta cells. The cell area was calculated using Image J software. Error bars are the standard error of mean.

