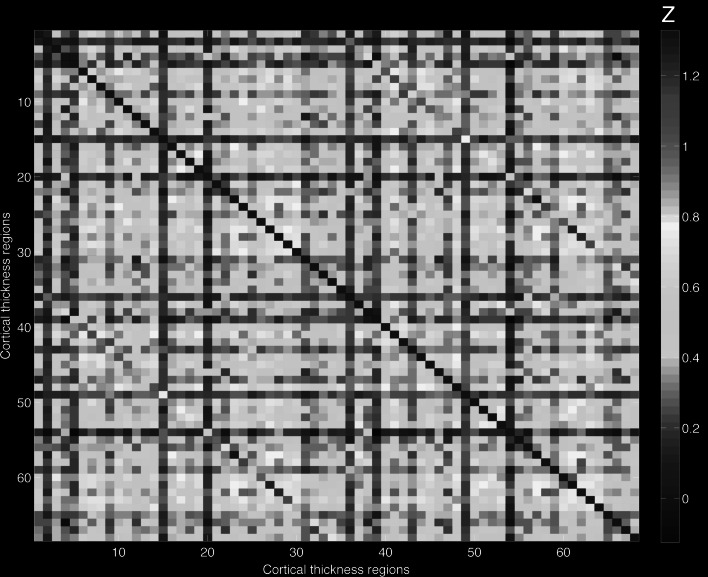
Fig. 2.
Cortical thickness coupling. The part above the diagonal represents the Z-values of the partial correlations controlled for AQ-28 (and age, sex, handedness, level of education and intracranial volume), the lower part of the diagonal represents the Z-values of the partial correlations controlled for age, sex, handedness, level of education and intracranial volume (see suppl. Table 1 for denotation of numbers)

