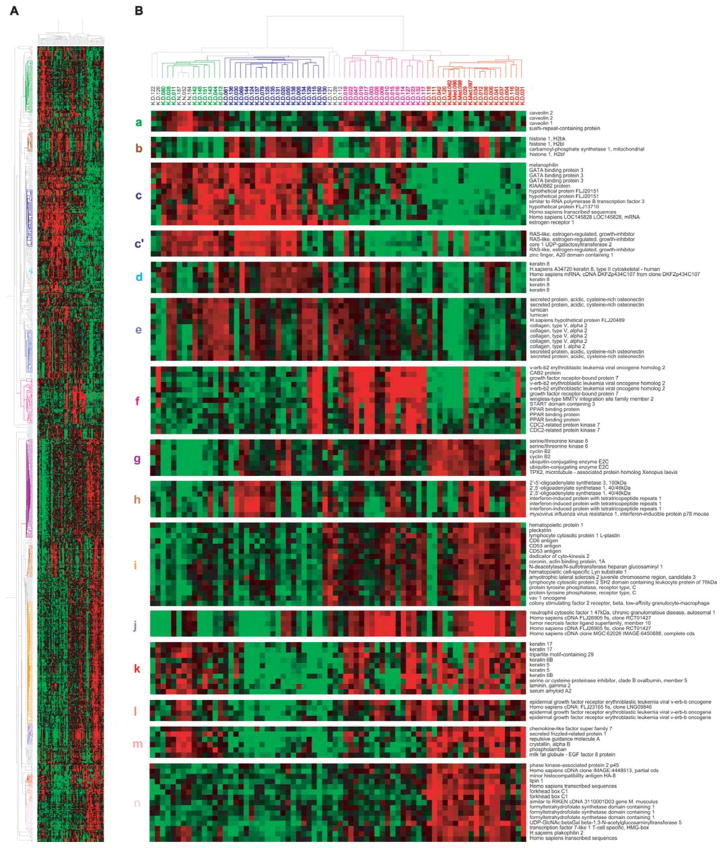
Figure 4.
Unsupervised hierarchical clustering of 69 tumors and 3 non-malignant tissues using the clones that passed the filtering described in Materials and methods. (A) A scaled-down representation of the entire cluster of 864 clones and 72 tissue samples based on similarities in gene expression. The colors of the representative gene clusters in the left are correspond to the colors of the lowercase letters shown in the left of B. (B) Top, dendrogram representing similarities in the expression patterns between experimental samples. The dendrogram further branched into smaller subgroups based on their basal and luminal characteristics, clustering with normal tissues and overexpression of ERBB2 amplicon: normal-like subgroup is shown in green; luminal in dark blue; ERBB2+ in pink; and basal in red. Bottom, (a) genes mainly expressed in normal-like subgroup; (b) histones; (c) luminal cluster including ESR1; (c′) RERG; (d) keratin 8; (e) stromal cluster; (f) ERBB2 amplicon; (g) cell cycle and check-point control (proliferation cluster); (h) interferon-related genes; (i) genes derived from immune cells; (j) TNFSF10 (TRAIL); (k) keratin 5/6 and 17; l, EGFR; (m) genes up-regulated in normal tissues and basal tumors, not in ERBB2+ subgroup; (n) genes exclusively up-regulated in basal tumors.

