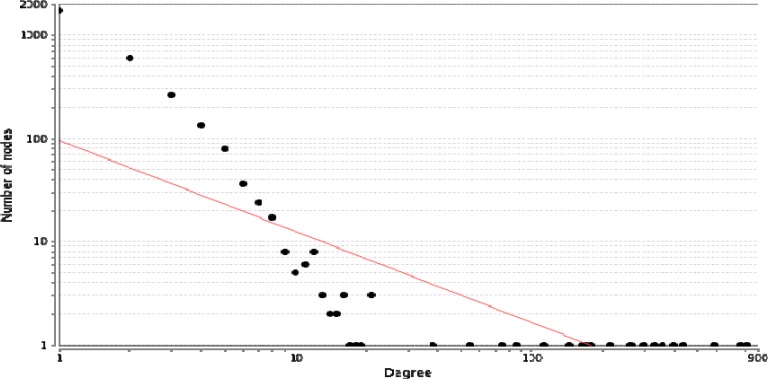
Figure 4.
A scale-free network. The degree distribution is significantly inhomogeneous. Just a few nodes show well linked, whereas others possess a small numbers of connections. This distribution implies on the presents of proteins with high centrality values computed by Network Analyzer. The red line indicates the power law. The R-squared value is computed on logarithmized values which is equal to 0.652 and the correlation= 0.9. Genes with high degree are in the right down region of the plot (their location is out of linear range).

