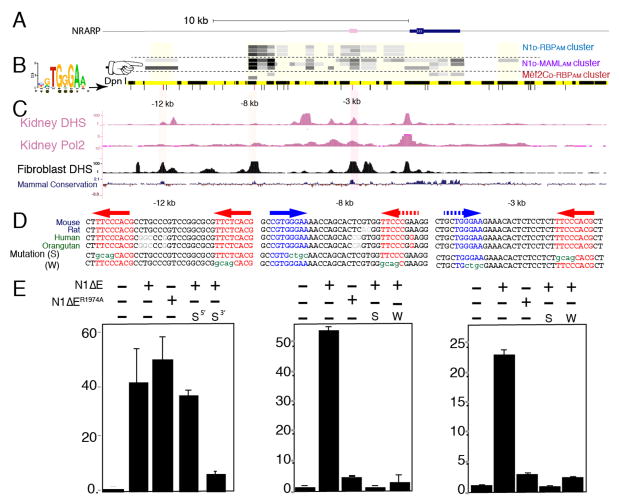
Figure 4. Notch SpDamID Identification of Notch Dimer-Dependent and Dimer-Independent Enhancers Upstream of Nrarp (see also Figure S4).
(A) Scaled diagram of the Nrarp locus. (B) From the top: SpDamID score of DpnI segments is shown (highest score=darkest shade of gray). The coverage of the sub-genomic array is shown as a light yellow box. The order of the experiments N1/RBP cluster (immature complex), N1/MAML cluster (mature complex), and Mef2c samples. Below, a virtual DpnI digest is shown in alternating yellow and black boxes. Consensus RBP half-sites are displayed as lines below it. Note that the −12kb region was only labeled by the Notch-MAML and Notch-p300 pairs but not the Notch dimer pairs (pointer). (C) ENCODE DNase hypersensitive (DHS) sites from kidney and fibroblasts, along with the mammalian conservation score from the UCSC Genome Browser. (D) Conserved sequences surrounding the consensus RBP binding sites (colored red or blue depicting + or − strand, respectively) in the −12, −8 and −3 enhancers. Potential weak sites are shown with a dashed arrow. Mutated strong (S) or weak (W) sequences are shown below. (E) Luciferase reporter assays using DpnI fragments with or without indicated mutations in RBP binding sites and responding to either activated N1ΔE or a dimer-deficient N1ΔER1974A. Error bars indicate standard deviation.

