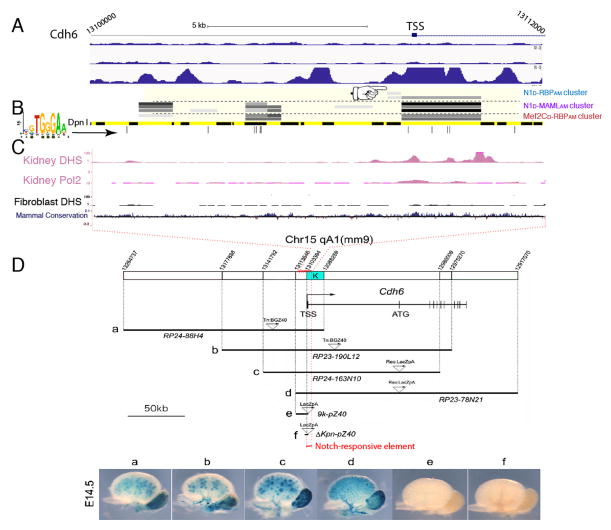
Figure 5. Notch SpDamID Identification of a Regulatory Region of Cdh6 (see also Figure S5).
(A) Scaled diagram of Cdh6 locus. Below are Notch1 and RBP ChIP peaks from TLL (top two tracks) and Notch ChIP from mK4 cells (bottom track). Binding downstream of the TSS is only seen in mK4 cells. (B) Overlapping segments identified by mature Notch complexes (pointer shows poor labeling by immature complexes). (C) ENCODE data indicates a DHS and Pol2 ChIP signal in kidney cells, but not in fibroblasts, at this location. (D) BAC transgenic analysis across the Cdh6 locus drives LacZ expression and β-Galactosidase activity within embryonic renal epithelia only when region K is included.

