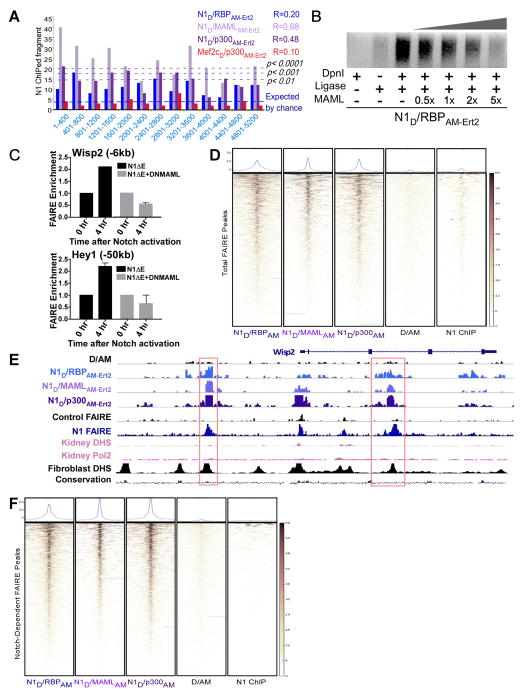
Figure 6. Mature Notch SpDamID Enriches for Sites Displaying Dynamic Chromatin Remodeling in Response to Notch Signaling (see also Figure S6).
(A) Binning of SpDamID segments based on score shows significant overlap by Notch SpDamID but not Mef2c/p300 with the fragments recovered by Notch ChIP in mK4 cells. Correlation between SpDamID score and Notch ChIP enrichment score is shown in the upper right quadrant. (B) Titration of MAML1 disrupts N1D/RBPAM-Ert2 complementation and impairs DNA methylation, reflected by loss of LMP products. (C) QPCR detecting FAIRE sites in Hey1 (−60kb) and Wisp2 (−6kb) that open 4 hours after γ-secretase inhibitor removal are not opened in the presence of DN-MAML. (D) Heat maps showing the overlap of SpDamID and Notch1 ChIP reads within a 5kb window centered on all of the FAIRE peaks in cells expressing active Notch. (E) Depiction of the Wisp2 locus showing SpDamID-seq reads (D/AM in black, N1D/RBPAM-Ert2 in blue, N1D/MAMLAM-Ert2 in light purple, and N1D/p300AM-Ert2 in dark purple) and FAIRE-seq reads from control cells (black) or cells expressing active Notch (dark blue). ENCODE data of mouse kidney DHS or Pol2 binding shown in pink. DHS in mouse fibroblasts and the mammalian conservation score shown in black. The red boxes highlight Notch-dependent FAIRE peaks present in cells expressing active Notch that are labeled by mature Notch SpDamID complexes. (F) Heat maps showing overlap of SpDamID and Notch1 ChIP reads with Notch-dependent FAIRE sites.

