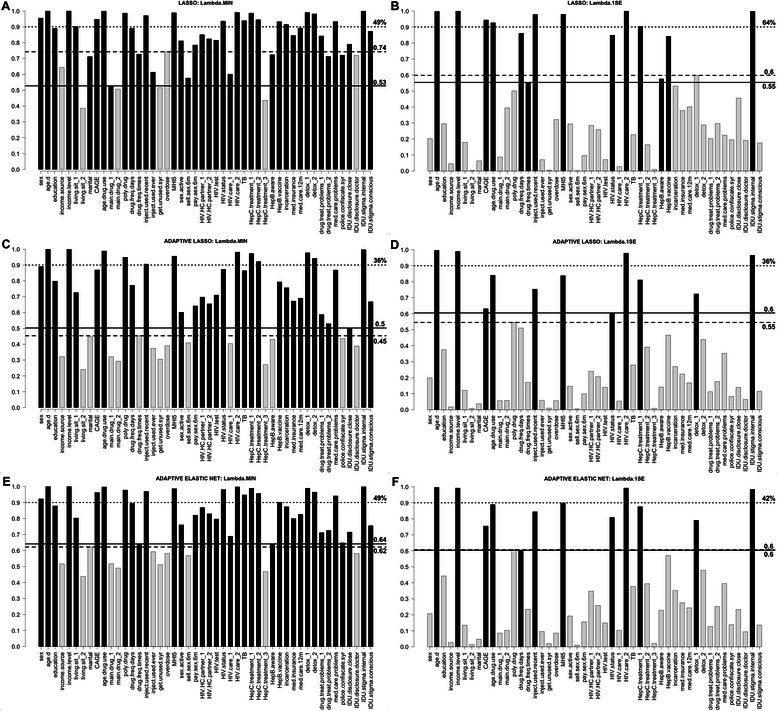
Fig. 2.

Bootstrap frequency of covariates selection in the final model using penalized regression. Dependent variable is EuroQoL 5D visual analogue scale measure of the health-related quality of life. a shows results of lasso corresponding to λmin, b—lasso corresponding to λ1se ; c and d—adaptive lasso with λmin (c) and λ1se (d); and e and f—adaptive elastic net with λmin (e) and λ1se (f). Black bars represent variables selected in the final model, and light grey bars—variables excluded from the final model. Solid line and the number next to it correspond to the minimum frequency among variables included in the final model; dashed line and the number next to it correspond to the maximum frequency among variables excluded from final subset. Dotted line corresponds to the frequency = 0.9, and number next to it shows the percentage of variables in the final model with inclusion frequency over 0.9 (out of the number of variables selected in the final model). Description of variable names is provided in the Additional file 2
