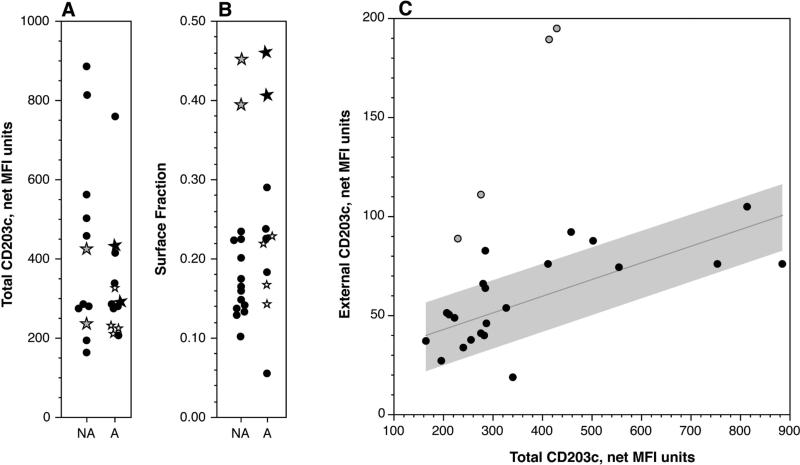
Figure 1.
Distributions of total and fractional surface expression of CD203c. Panel A: Total (internal+external) CD203c (see methods) distribution. The grey-filled plotted points represent the 3 data points shown in panel B that were grouped separately by a hierarchal clustering algorithm. Stars represent repeated measurements of 3 different subjects (different star symbols distinguish the subjects). NA = reported non-atopic, A = reported atopic. Panel B: Fraction of total CD203c expressed on the cell surface (accessible without permeabilization) for the same group of subjects. The symbols follow the description for panel A. Panel C: Relationship between total CD203c and surface CD203c. The least squares fit of the solid data points is shown with a grey region delineating 1 standard deviation above and below the line. The grey-filled data points represent the unique group identified in panel B.

