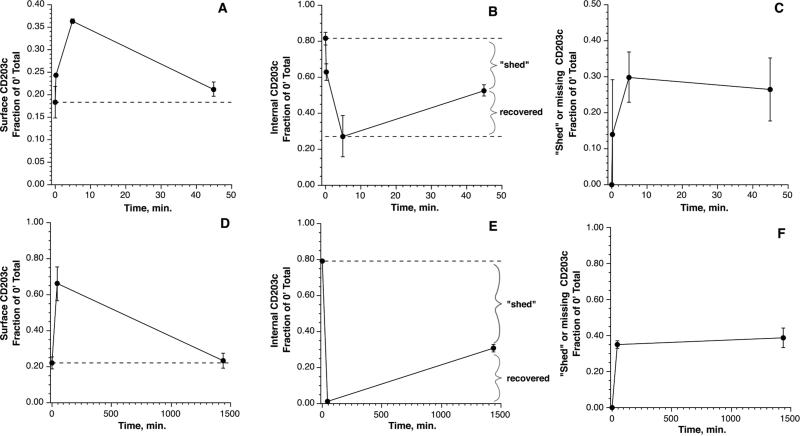
Figure 2.
Panels A-C: kinetics of cell surface, internal and missing CD203c during stimulation with 1 μM FMLP. All results are expressed as a fraction of the pre-stimulation total CD203c levels (n=3). Panel A: cell surface CD203c. Panel B: internal CD203c, calculated from the total – surface CD203c at the respective time point (but expressed relative to the 0 minute time point). Panel C: lost or shed CD203c, calculated from the total CD203c at time 0 – total at the respective time. Panels D-F: kinetics of cell surface, internal and lost/shed CD203c during stimulation with 10 ng/ml IL-3. The calculations were similar to those in panels A-C.

