Figure 4.
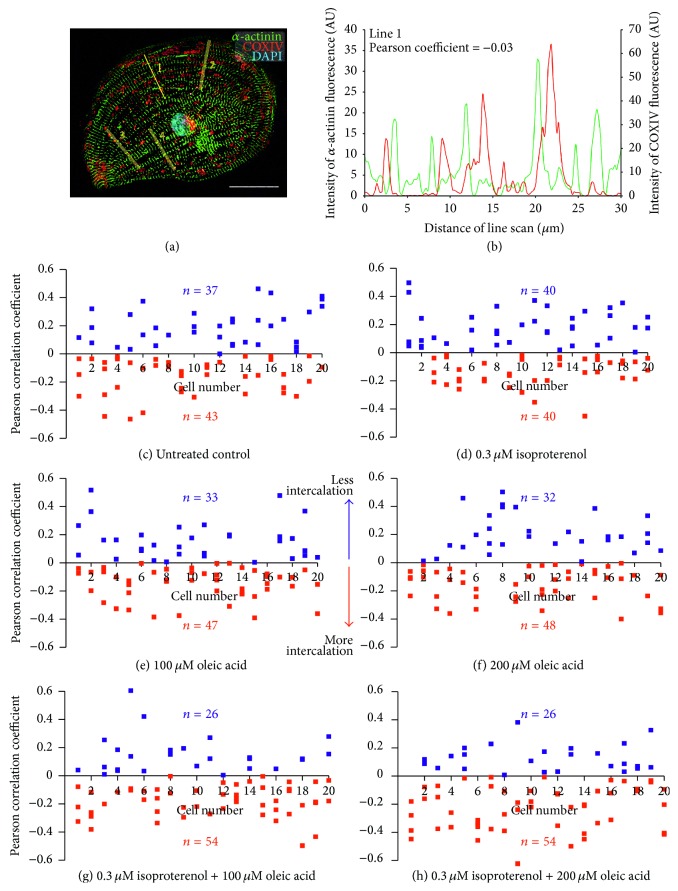
Effect of isoproterenol and oleic acid on the intercalation of the mitochondria between the myofibrils. (a) Representative example of an hESC-vCM that had been immunolabeled with antibodies to α-actinin and COX IV and costained with DAPI, to label the myofibrils, mitochondria, and nucleus, respectively. Four line scan analyses were then performed per cell, such that the lines were placed perpendicular to the orientation of the myofibrils and were kept away from the nucleus. Scale bar is 30 μm. (b) Representative line graph to show the intensity of fluorescence of α-actinin (green) and COX IV (red) labeling along line 1 from panel A. The Pearson correlation coefficient (PCC) was calculated to be −0.03. (c–h) Series of scatter graphs to show the PCC determined for each of 4 lines in n = 20 cells in (c) untreated controls and (d–h) following treatment with (d) 0.3 μM isoproterenol, (e) 100 μM oleic acid, (f) 200 μM oleic acid, (g) 0.3 μM isoproterenol plus 100 μM oleic acid, or (h) 0.3 μM isoproterenol plus 200 μM oleic acid. Numbers in blue and red indicate line scans exhibiting positive and negative PCC values, respectively, the latter indicating a higher level of intercalation between the COX IV labeled mitochondria and the α-actinin-labeled myofibrils.

