. 2015 Aug 20;19(5):435–440. doi: 10.4196/kjpp.2015.19.5.435

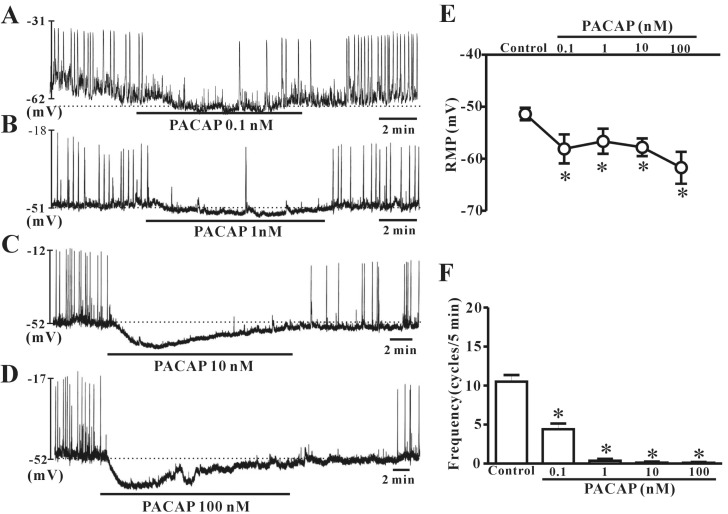
Fig. 2. Effects of various concentrations of pituitary adenylate cyclase-activating peptide (PACAP) on pacemaker potentials recorded in cultured interstitial cells of Cajal (ICC) from mouse colon. (A), (B), (C), and (D) show pacemaker potentials of ICC exposed to PACAP (0.1 nM, 1 nM, 10 nM, or 100 nM) under current-clamp mode (I=0). Vertical solid lines represent the amplitude of pacemaker potentials and horizontal solid lines represent the duration of recording (s) of pacemaker potentials. The dotted lines indicate the resting membrane potential. (E) and (F) summarize the effects of PACAP on pacemaker potentials in ICC. Bars represent the means±SE. *Asterisks indicate a statistically significant difference from controls (p<0.05). Con, control.

Fig. 2