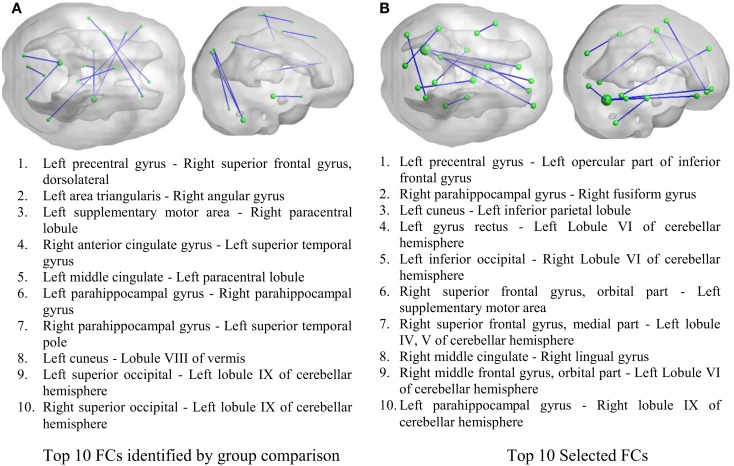
Figure 3.
Inter-regional resting-state functional connectivity. (A) The top 10 FCs with smallest p value in group comparison. (B) The top 10 FCs selected by RF as features. Top: 3D rendering demonstrating the FCs. The nodal size is proportional to the nodal degree. Bottom: the AAL ROI names of the identified regions.

