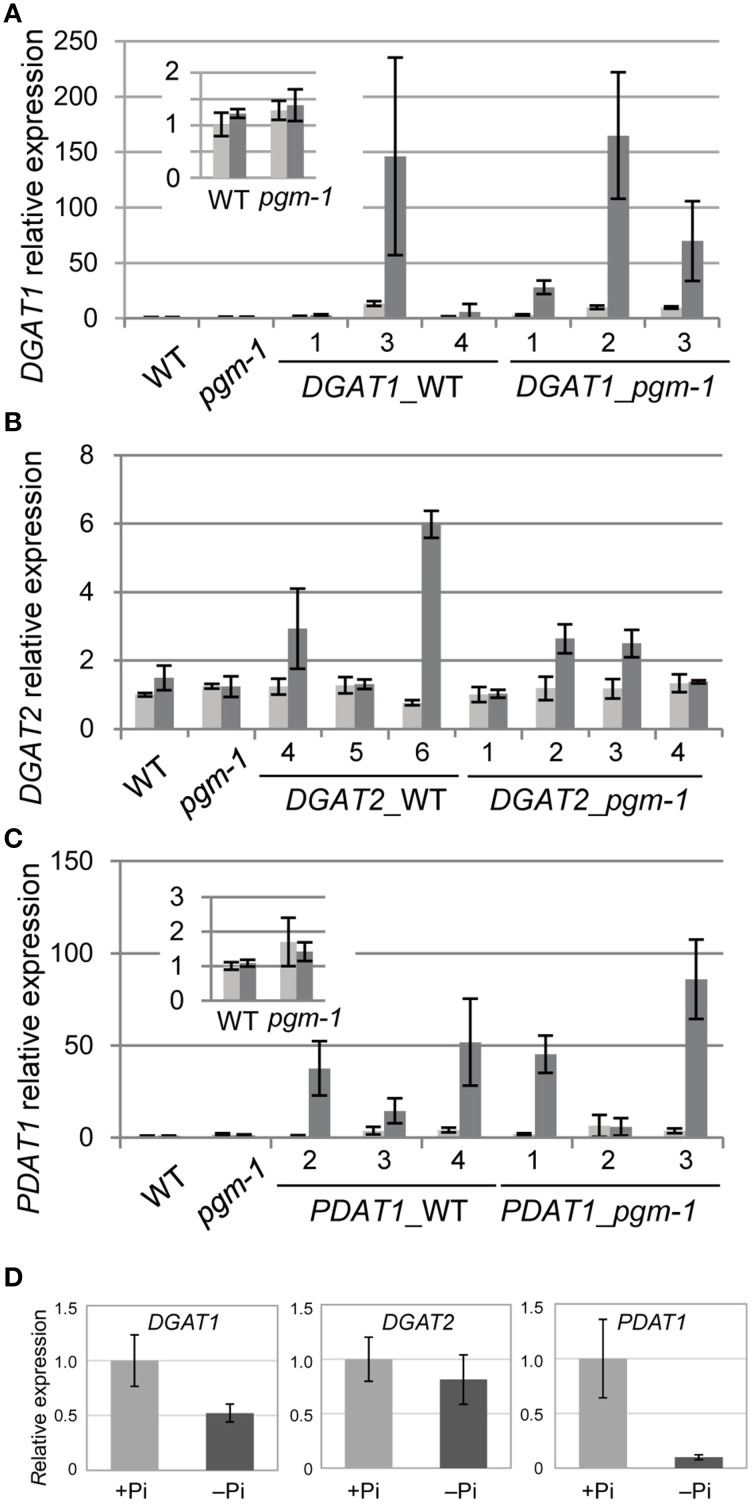
Figure 4.
Quantitative reverse transcription-PCR analysis of DGAT1, DGAT2, and PDAT1 expression in WT, pgm-1, and transgenic Arabidopsis plants under Pi-sufficient or Pi-depleted conditions. Seedlings (10 d old) of transgenic lines were transferred to MS medium containing 1% (w/v) sucrose, and 0 mM Pi (dark gray bars) or 1 mM Pi (light gray bars) and were grown for 10 d. (A) DGAT1, (B) DGAT2, and (C) PDAT1 mRNA levels in shoots of WT, pgm-1, and transgenic lines in the WT and pgm-1 backgrounds are shown. Line numbers are indicated for each transgenic strain. The expression level of each gene is relative to that in WT under Pi-sufficient conditions. Data are the mean ± SD from three independent experiments. (D) mRNA levels of DGAT1, DGAT2, and PDAT1 in roots of WT plants under Pi-sufficient (+Pi) and Pi-depleted (–Pi) conditions. The expression level of each gene is relative to that in WT under Pi-sufficient conditions. Data are the mean ± SD from three independent experiments.

